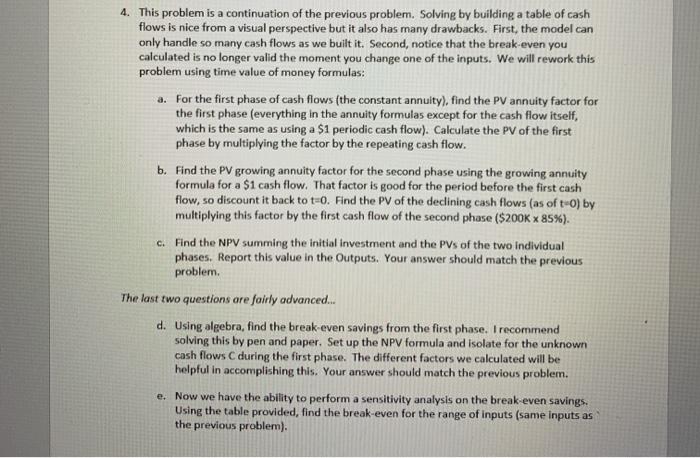
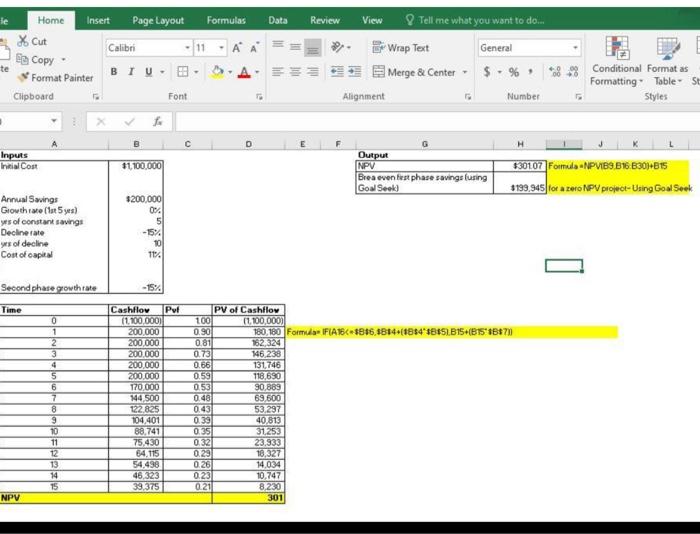
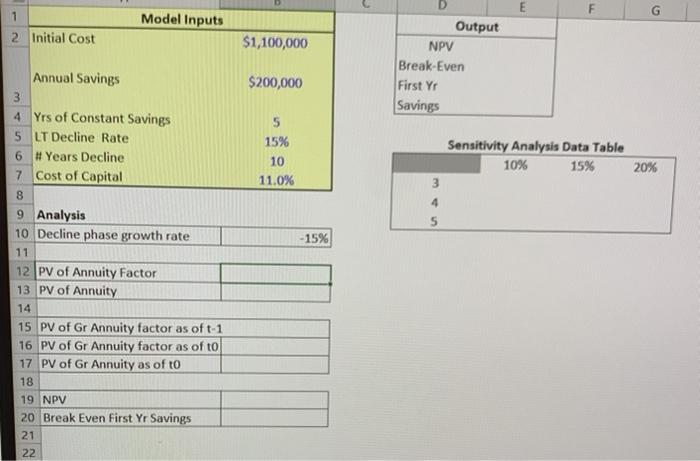
4. This problem is a continuation of the previous problem. Solving by building a table of cash flows is nice from a visual perspective but it also has many drawbacks. First, the model can only handle so many cash flows as we built it. Second, notice that the break-even you calculated is no longer valid the moment you change one of the inputs. We will rework this problem using time value of money formulas: a. For the first phase of cash flows (the constant annuity), find the PV annuity factor for the first phase (everything in the annuity formulas except for the cash flow itself, which is the same as using a $1 periodic cash flow). Calculate the PV of the first phase by multiplying the factor by the repeating cash flow. b. Find the PV growing annuity factor for the second phase using the growing annuity formula for a $1 cash flow. That factor is good for the period before the first cash flow, so discount it back to t-0. Find the PV of the declining cash flows (as of to) by multiplying this factor by the first cash flow of the second phase ($200K 85%). c. Find the NPV summing the initial investment and the PVs of the two individual phases. Report this value in the Outputs. Your answer should match the previous problem. The last two questions are fairly advanced... d. Using algebra, find the break even savings from the first phase. I recommend solving this by pen and paper. Set up the NPV formula and isolate for the unknown cash flows C during the first phase. The different factors we calculated will be helpful in accomplishing this. Your answer should match the previous problem. e. Now we have the ability to perform a sensitivity analysis on the break-even savings. Using the table provided, find the break-even for the range of inputs (same inputs as the previous problem). Formulas Data Review View ie Home Insert Page Layout X Cut Calibri Be Copy te Format Painter Clipboard Font Tell me what you want to do... Wrap Text General Merge & Center $ . % EES Conditional Format as Formatting Table St Styles Alignment Number . B o L Inputs Initial Cost 11.100.000 Output NPV Brea even test phase savings using Goal Seek) $301.07 Formula - NPVIB3, B16 B30)+815 $199,945 to a zero NPV project-Using Goal Seek Annual Savings Growthre (5) yes of constant savings Declinerale yrs of decline Cost of capital $200,000 0% 5 -15% 10 114 Second phare growth rate -15% Time Puf 150, 180 Formula FA186 4866,1814-(1884'88651.815+(B15*1887 0 1 2 3 4 5 6 7 8 9 10 11 12 13 14 15 Cashllow (1.100.000) 200.000 200,000 200.000 200.000 200.000 170.000 144.500 122.825 104,401 88.741 75,430 54.115 54,498 46,323 39,375 PV of Cashflow 100 11,100,000) 0.90 0.81 162.324 0.73 146.238 0.66 131,746 0.59 118,630 053 30.889 0.48 69,600 0.43 53.297 0.39 40.813 0.35 31.253 0.32 23.333 0.29 18,327 0.26 14,034 0.23 10.747 0.21 8.230 301 NPV E 1 Model Inputs 2 Initial Cost $1,100,000 D Output NPV Break-Even First Yr Savings $200,000 5 15% 10 11.0% Sensitivity Analysis Data Table 10% 15% 3 20% 4 5 -15% Annual Savings 3 4 Yrs of Constant Savings 5 LT Decline Rate 6 # Years Decline 7 Cost of Capital 8 9 Analysis 10 Decline phase growth rate 11 12 PV of Annuity Factor 13 PV of Annuity 14 15 PV of Gr Annuity factor as oft-1 16 PV of Gr Annuity factor as of to 17 PV of Gr Annuity as of to 18 19 NPV 20 Break Even First Yr Savings 21 22 4. This problem is a continuation of the previous problem. Solving by building a table of cash flows is nice from a visual perspective but it also has many drawbacks. First, the model can only handle so many cash flows as we built it. Second, notice that the break-even you calculated is no longer valid the moment you change one of the inputs. We will rework this problem using time value of money formulas: a. For the first phase of cash flows (the constant annuity), find the PV annuity factor for the first phase (everything in the annuity formulas except for the cash flow itself, which is the same as using a $1 periodic cash flow). Calculate the PV of the first phase by multiplying the factor by the repeating cash flow. b. Find the PV growing annuity factor for the second phase using the growing annuity formula for a $1 cash flow. That factor is good for the period before the first cash flow, so discount it back to t-0. Find the PV of the declining cash flows (as of to) by multiplying this factor by the first cash flow of the second phase ($200K 85%). c. Find the NPV summing the initial investment and the PVs of the two individual phases. Report this value in the Outputs. Your answer should match the previous problem. The last two questions are fairly advanced... d. Using algebra, find the break even savings from the first phase. I recommend solving this by pen and paper. Set up the NPV formula and isolate for the unknown cash flows C during the first phase. The different factors we calculated will be helpful in accomplishing this. Your answer should match the previous problem. e. Now we have the ability to perform a sensitivity analysis on the break-even savings. Using the table provided, find the break-even for the range of inputs (same inputs as the previous problem). Formulas Data Review View ie Home Insert Page Layout X Cut Calibri Be Copy te Format Painter Clipboard Font Tell me what you want to do... Wrap Text General Merge & Center $ . % EES Conditional Format as Formatting Table St Styles Alignment Number . B o L Inputs Initial Cost 11.100.000 Output NPV Brea even test phase savings using Goal Seek) $301.07 Formula - NPVIB3, B16 B30)+815 $199,945 to a zero NPV project-Using Goal Seek Annual Savings Growthre (5) yes of constant savings Declinerale yrs of decline Cost of capital $200,000 0% 5 -15% 10 114 Second phare growth rate -15% Time Puf 150, 180 Formula FA186 4866,1814-(1884'88651.815+(B15*1887 0 1 2 3 4 5 6 7 8 9 10 11 12 13 14 15 Cashllow (1.100.000) 200.000 200,000 200.000 200.000 200.000 170.000 144.500 122.825 104,401 88.741 75,430 54.115 54,498 46,323 39,375 PV of Cashflow 100 11,100,000) 0.90 0.81 162.324 0.73 146.238 0.66 131,746 0.59 118,630 053 30.889 0.48 69,600 0.43 53.297 0.39 40.813 0.35 31.253 0.32 23.333 0.29 18,327 0.26 14,034 0.23 10.747 0.21 8.230 301 NPV E 1 Model Inputs 2 Initial Cost $1,100,000 D Output NPV Break-Even First Yr Savings $200,000 5 15% 10 11.0% Sensitivity Analysis Data Table 10% 15% 3 20% 4 5 -15% Annual Savings 3 4 Yrs of Constant Savings 5 LT Decline Rate 6 # Years Decline 7 Cost of Capital 8 9 Analysis 10 Decline phase growth rate 11 12 PV of Annuity Factor 13 PV of Annuity 14 15 PV of Gr Annuity factor as oft-1 16 PV of Gr Annuity factor as of to 17 PV of Gr Annuity as of to 18 19 NPV 20 Break Even First Yr Savings 21 22