Answered step by step
Verified Expert Solution
Link Copied!

Question

1 Approved Answer

4) US Treasury Bond Rates (%) Income statement (thousands) S-year 1.00 Interest expense 500 10 year 2.00 EBIT 1,000 30-year 3.00 Pre-tax income 500 Income
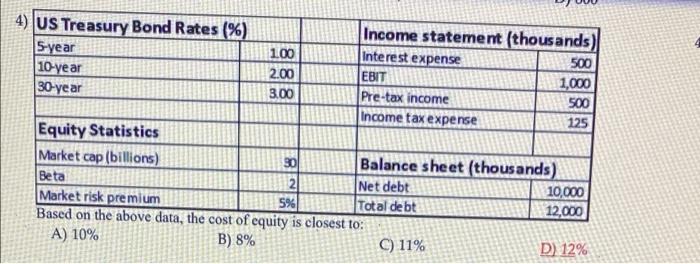
image text in transcribed
4) US Treasury Bond Rates (%) Income statement (thousands) S-year 1.00 Interest expense 500 10 year 2.00 EBIT 1,000 30-year 3.00 Pre-tax income 500 Income tax expense 125 Equity Statistics Market cap (billions) 30 Balance sheet (thousands) Beta 2 Net debt 10,000 Market risk premium 5% Total debt 12,000 Based on the above data, the cost of equity is closest to: A) 10% B) 8% C) 11% D) 12%

Step by Step Solution

There are 3 Steps involved in it

Step: 1

blur-text-image

Get Instant Access to Expert-Tailored Solutions

See step-by-step solutions with expert insights and AI powered tools for academic success

Step: 2

blur-text-image

Step: 3

blur-text-image

Ace Your Homework with AI

Get the answers you need in no time with our AI-driven, step-by-step assistance

Get Started

Recommended Textbook for

Handbook For Surviving The Global Financial Crisis

Authors: Barbara Goldsmith

1st Edition

1514811995, 978-1514811993

More Books

Students also viewed these Finance questions

Question

1. Why do people tell lies on their CVs?

Answered: 1 week ago

Question

2. What is the difference between an embellishment and a lie?

Answered: 1 week ago