4-. Use the Interpretation of p-values table in order to assess the arnountof evidence against Ha, based on the observed data. Records of 105 trafc
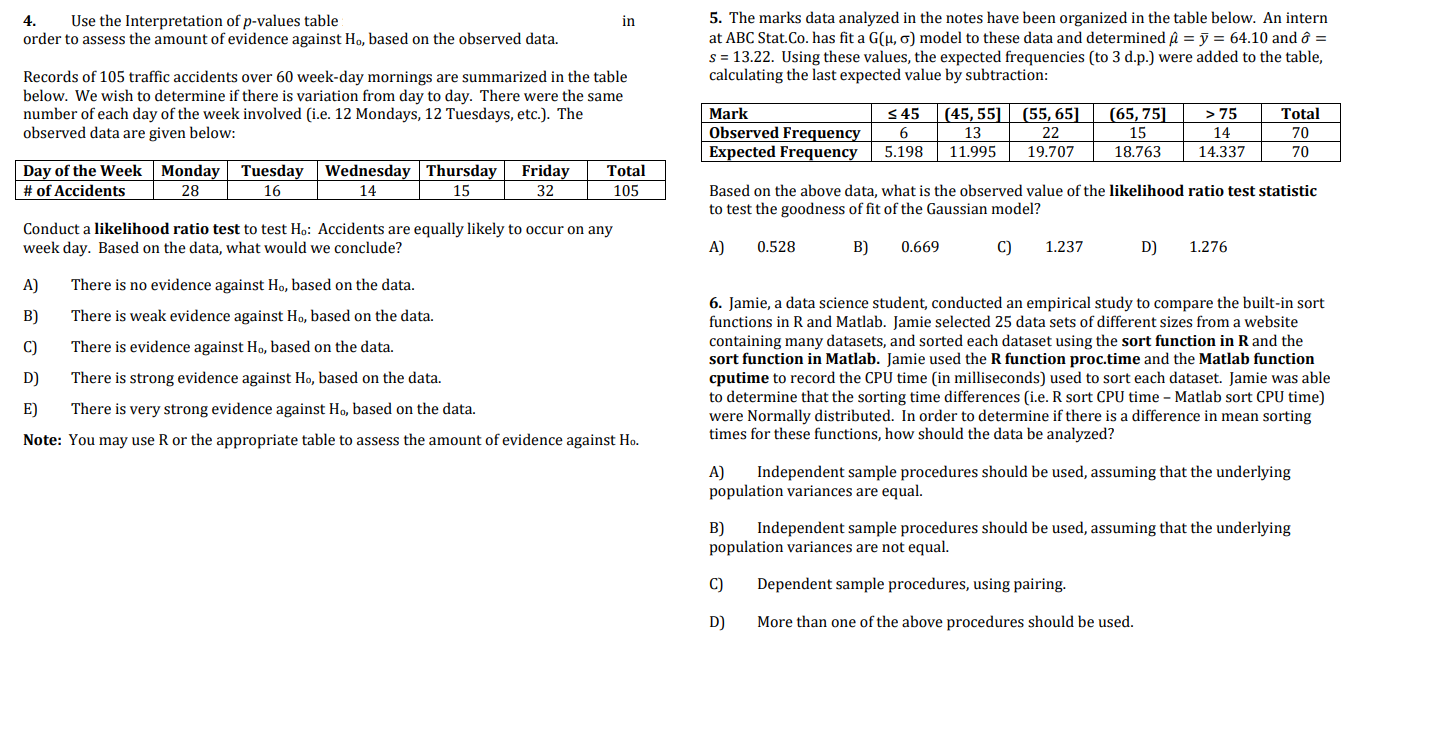
4-. Use the Interpretation of p-values table in order to assess the arnountof evidence against Ha, based on the observed data. Records of 105 trafc accidents over 60 week-day mornings are summarized in the table below. We wish to determine if there is variation from day to day. There were the same 5. The marks data analyzed in the notes have been organized in the table below. An intern at ABC Statco. has t a Gui. a) model to these data and determined 11 = 37 = 64.10 and c? = s = 13.22. Using these values, the expected frequencies {to 3 d.p.) were added to the table. calculating the last expected value by subtraction: number of each day of the week involved [i.e. 12 Mondays, 12 Tuesdays. etc). The Mark S 45 (4-5, 55] (55, 65] (65, 75] > 75 Total observed data are given below: Observed Frequency 6 13 22 15 14- 70 Expected Frequency 5.198 11.995 19.707 18.763 14.337 70 DayoflheWeek Monday Tuesday Wednesday Thursday Friday Total it of Accidents 28 16 14 15 32 105 Conduct a likelihood ratio test to test Ha: Accidents are equally likely to occur on any weekday. Based on die data. what would we conclude? A) There is no evidence against Ha, based on the data. B) There is weak evidence against Ha. based on the data. C) There is evidence against Ha, based on the data. D] There is strong evidence against H-. based on the data. E] There is very strong evidence against l-In, based on the data. Note: You may use R or the appropriate table to assess the amount of evidence against Ho. Based on the above data. what is the observed value of the likelihood ratio test statistic to test the goodness of tof the Gaussian model? A) 0.528 B] 0.669 [I] 1.237 D] 1.276 6. Jamie, a data science student. conducted an empirical study to compare the built-in sort functions in R and Matiab. Jamie selected 25 data sets of different sizes from a website containing many datasets. and sorted each dataset using the sort function in Rand the sort function in Madab. Jamie used the Rfunction pI'DCJJ'me and the Matlab function cputirne to record the CPU time (in milliseconds] used to sort each dataset. Iamie was able to determine that the surng time differences {i.e. R sort CPU time - Matlab sort CPU time] were Normally distributed. In order to determine if there is a difference in mean sorting times for these functions. how should the data be analyzed? A) Independent sample procedures should be used, assuming that the underlying population variances are equal. B) Independent sample procedures should be used, assuming that the underlying population variances are not equal. C) Dependent sample procedures. using pairing. D] More than one of the above procedures should be used
Step by Step Solution
There are 3 Steps involved in it
Step: 1
Get Instant Access to Expert-Tailored Solutions
See step-by-step solutions with expert insights and AI powered tools for academic success
Step: 2
Step: 3
Ace Your Homework with AI
Get the answers you need in no time with our AI-driven, step-by-step assistance