4. What does this formula represent? Number of times something happened Number of times it could have happened a. Rate b. Assumption c. Mystery d.
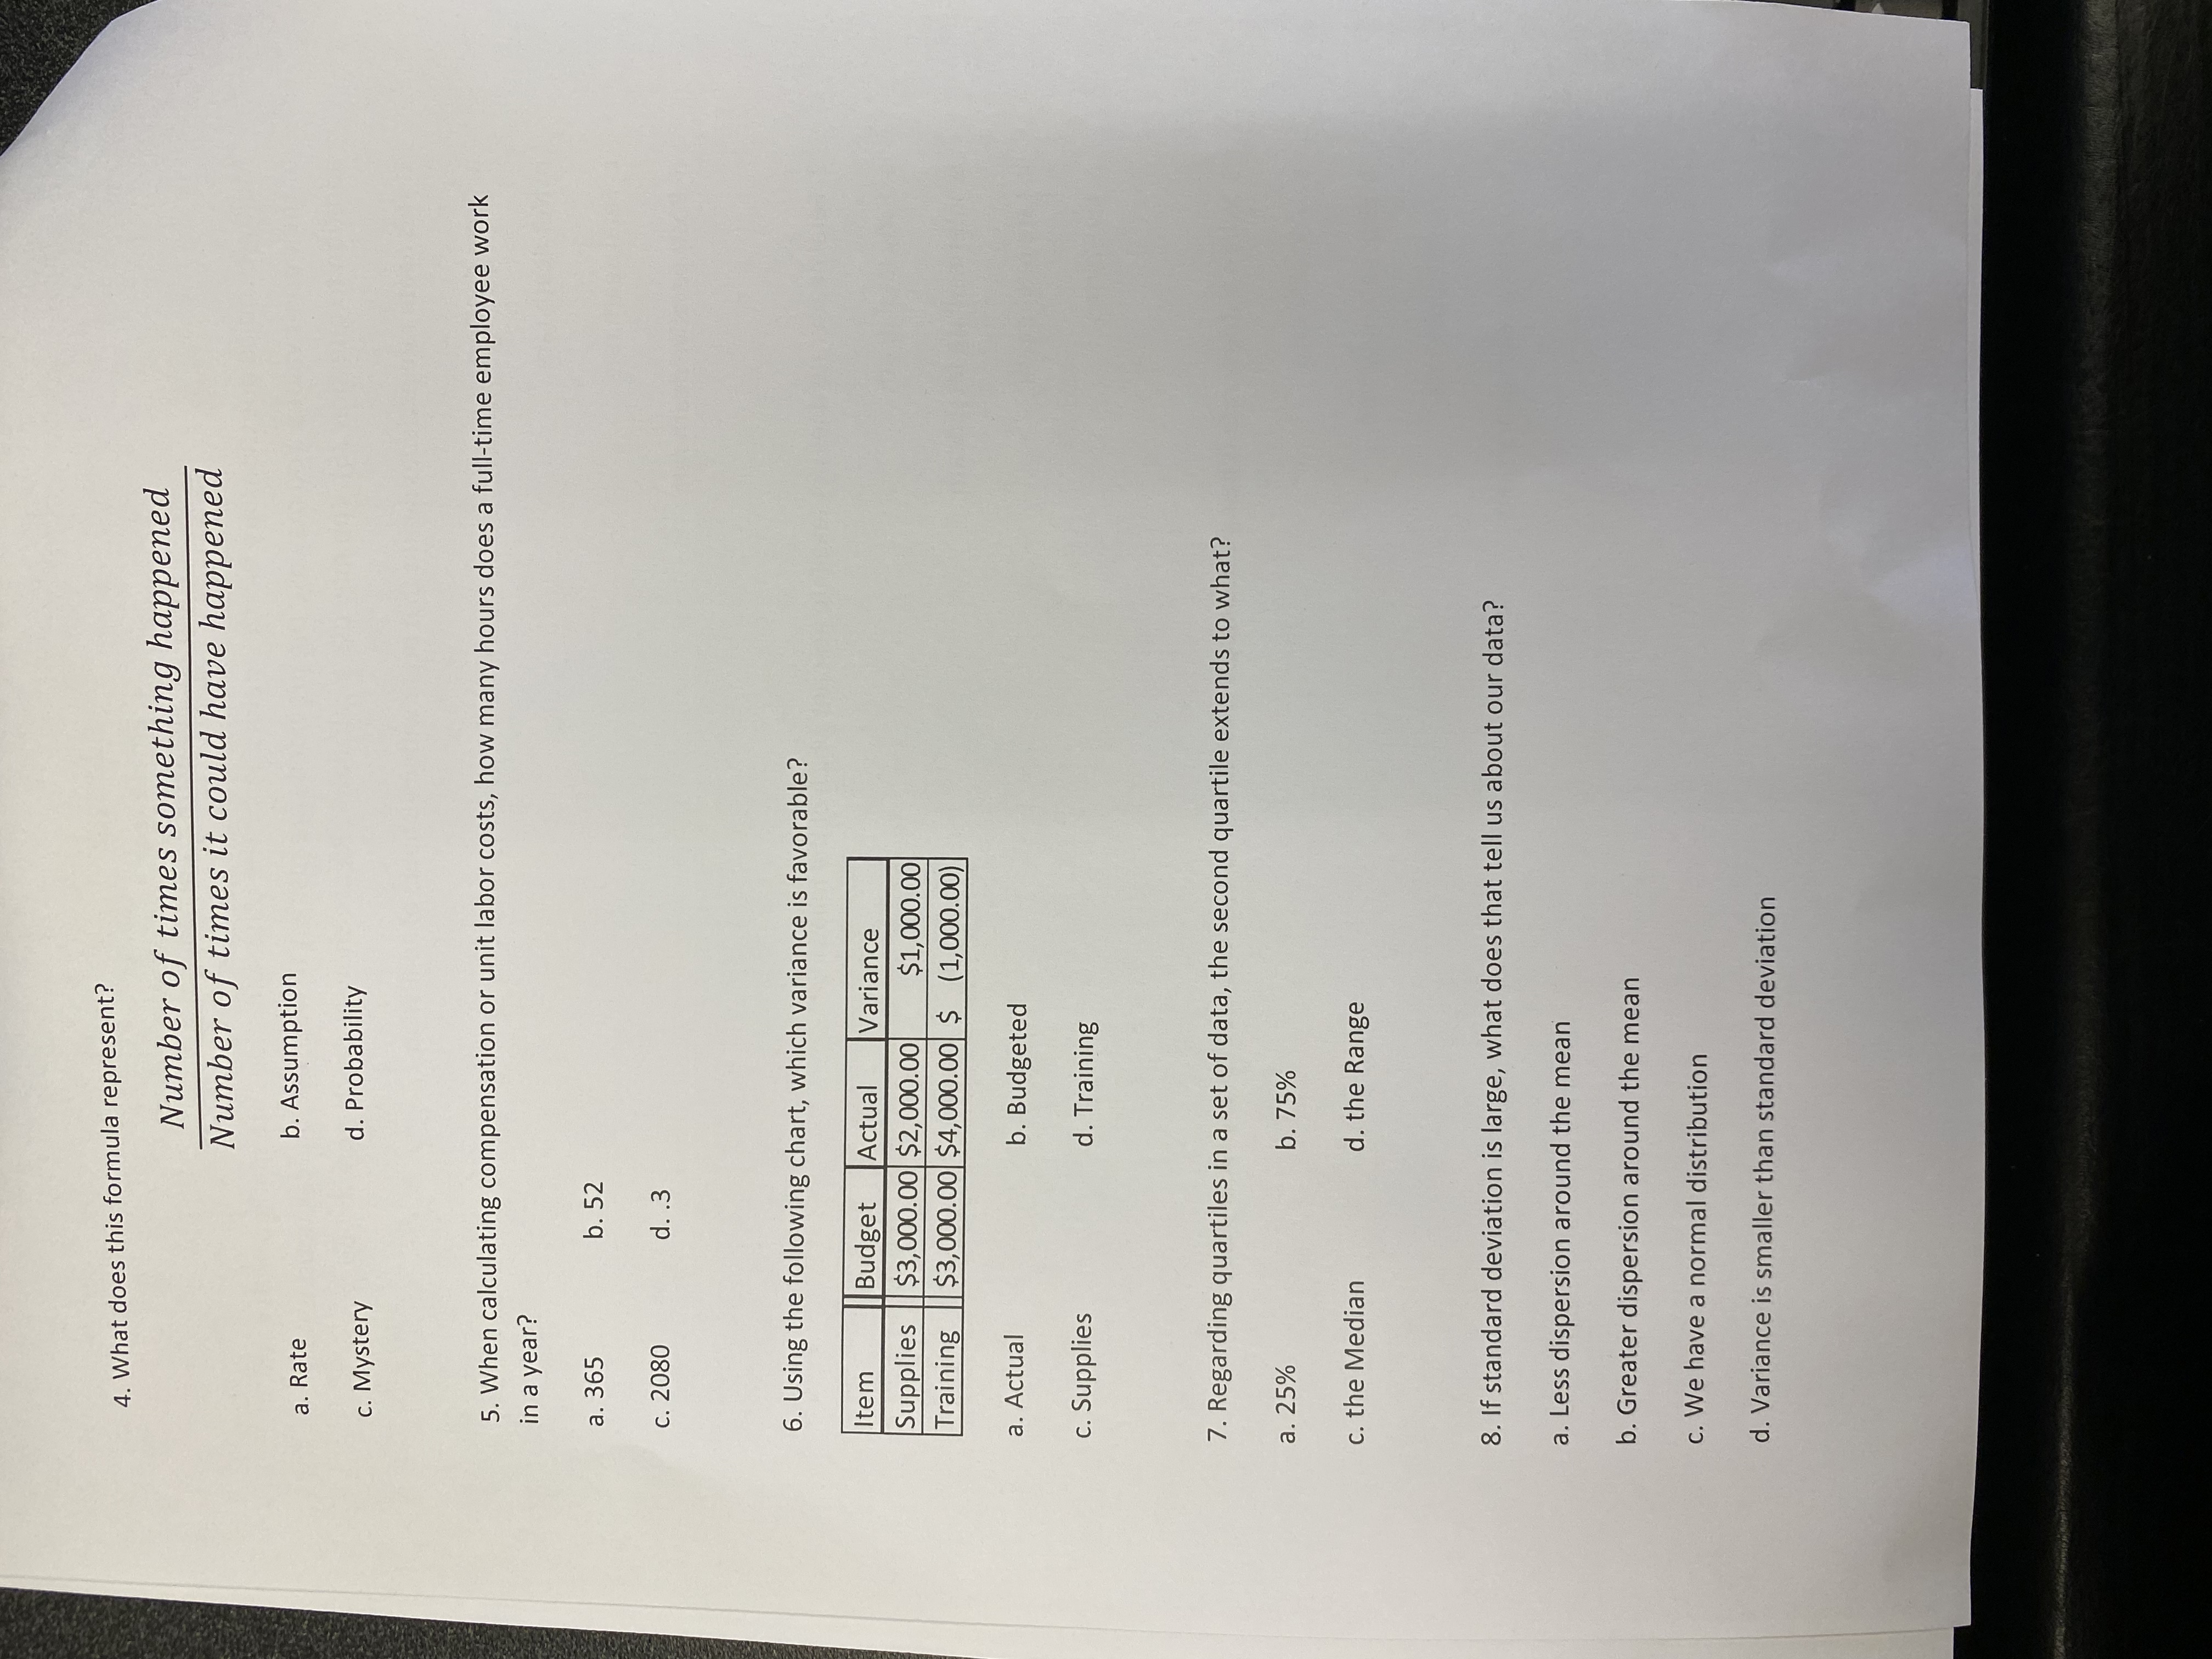
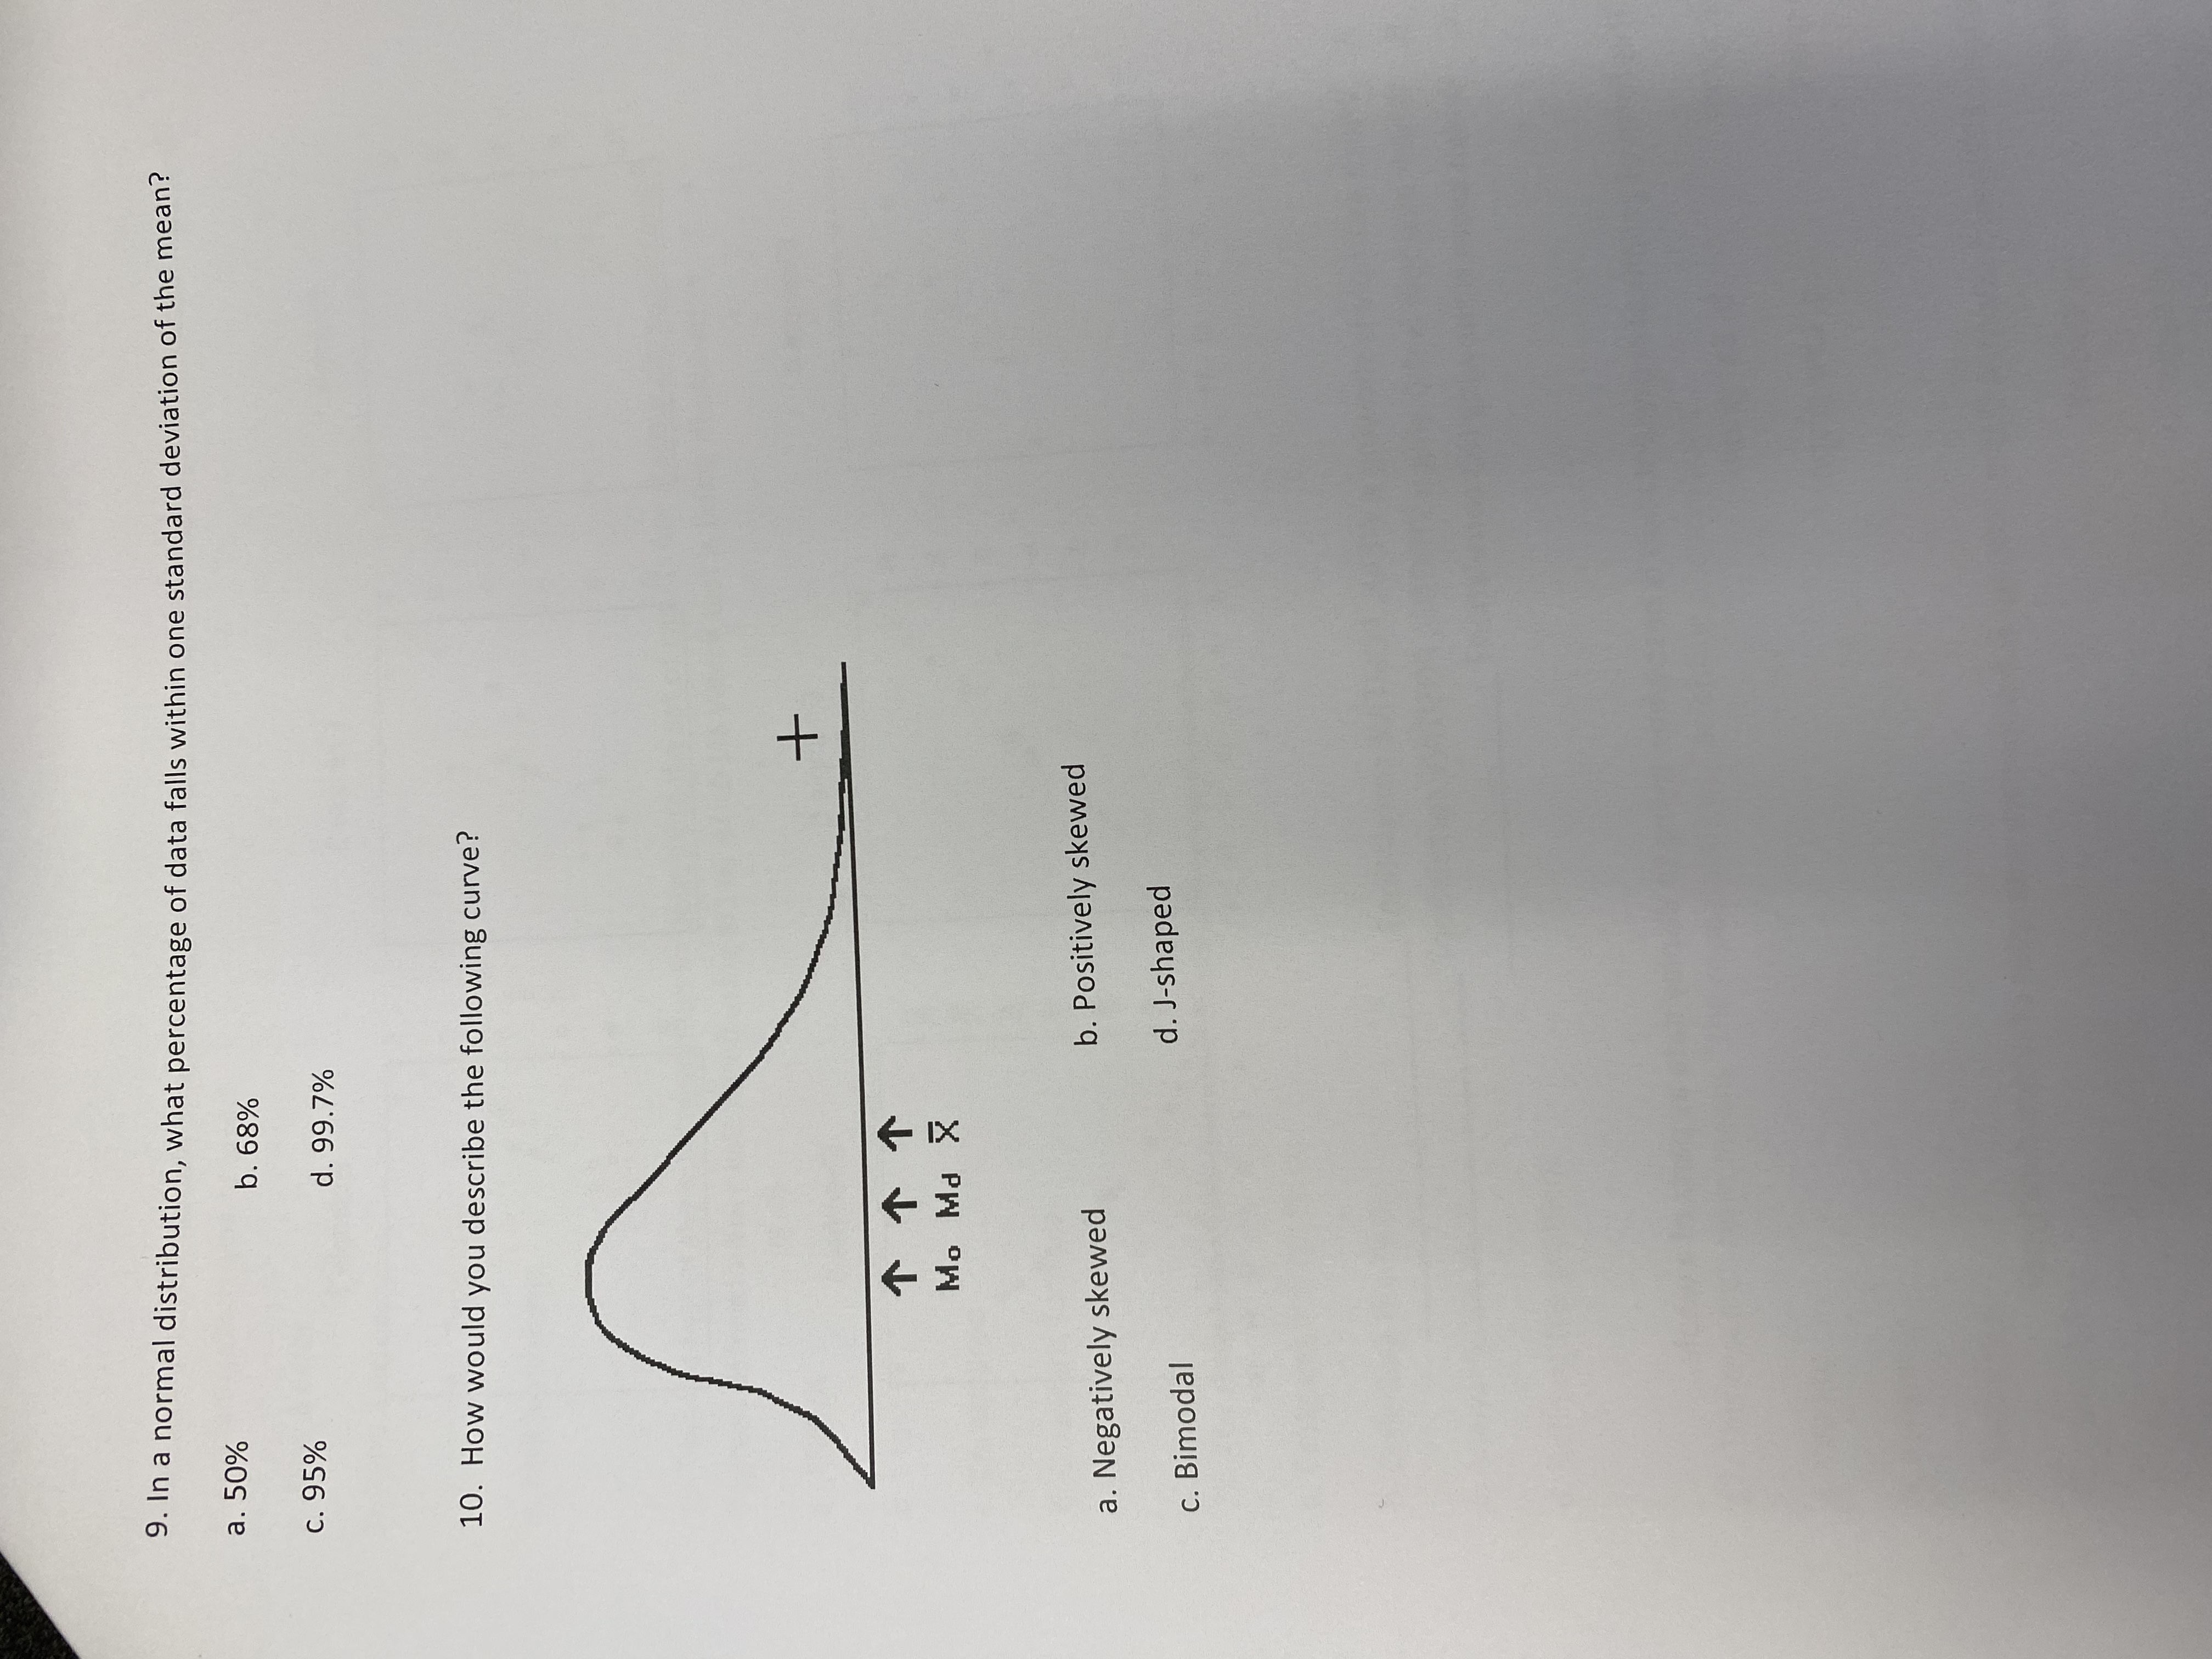
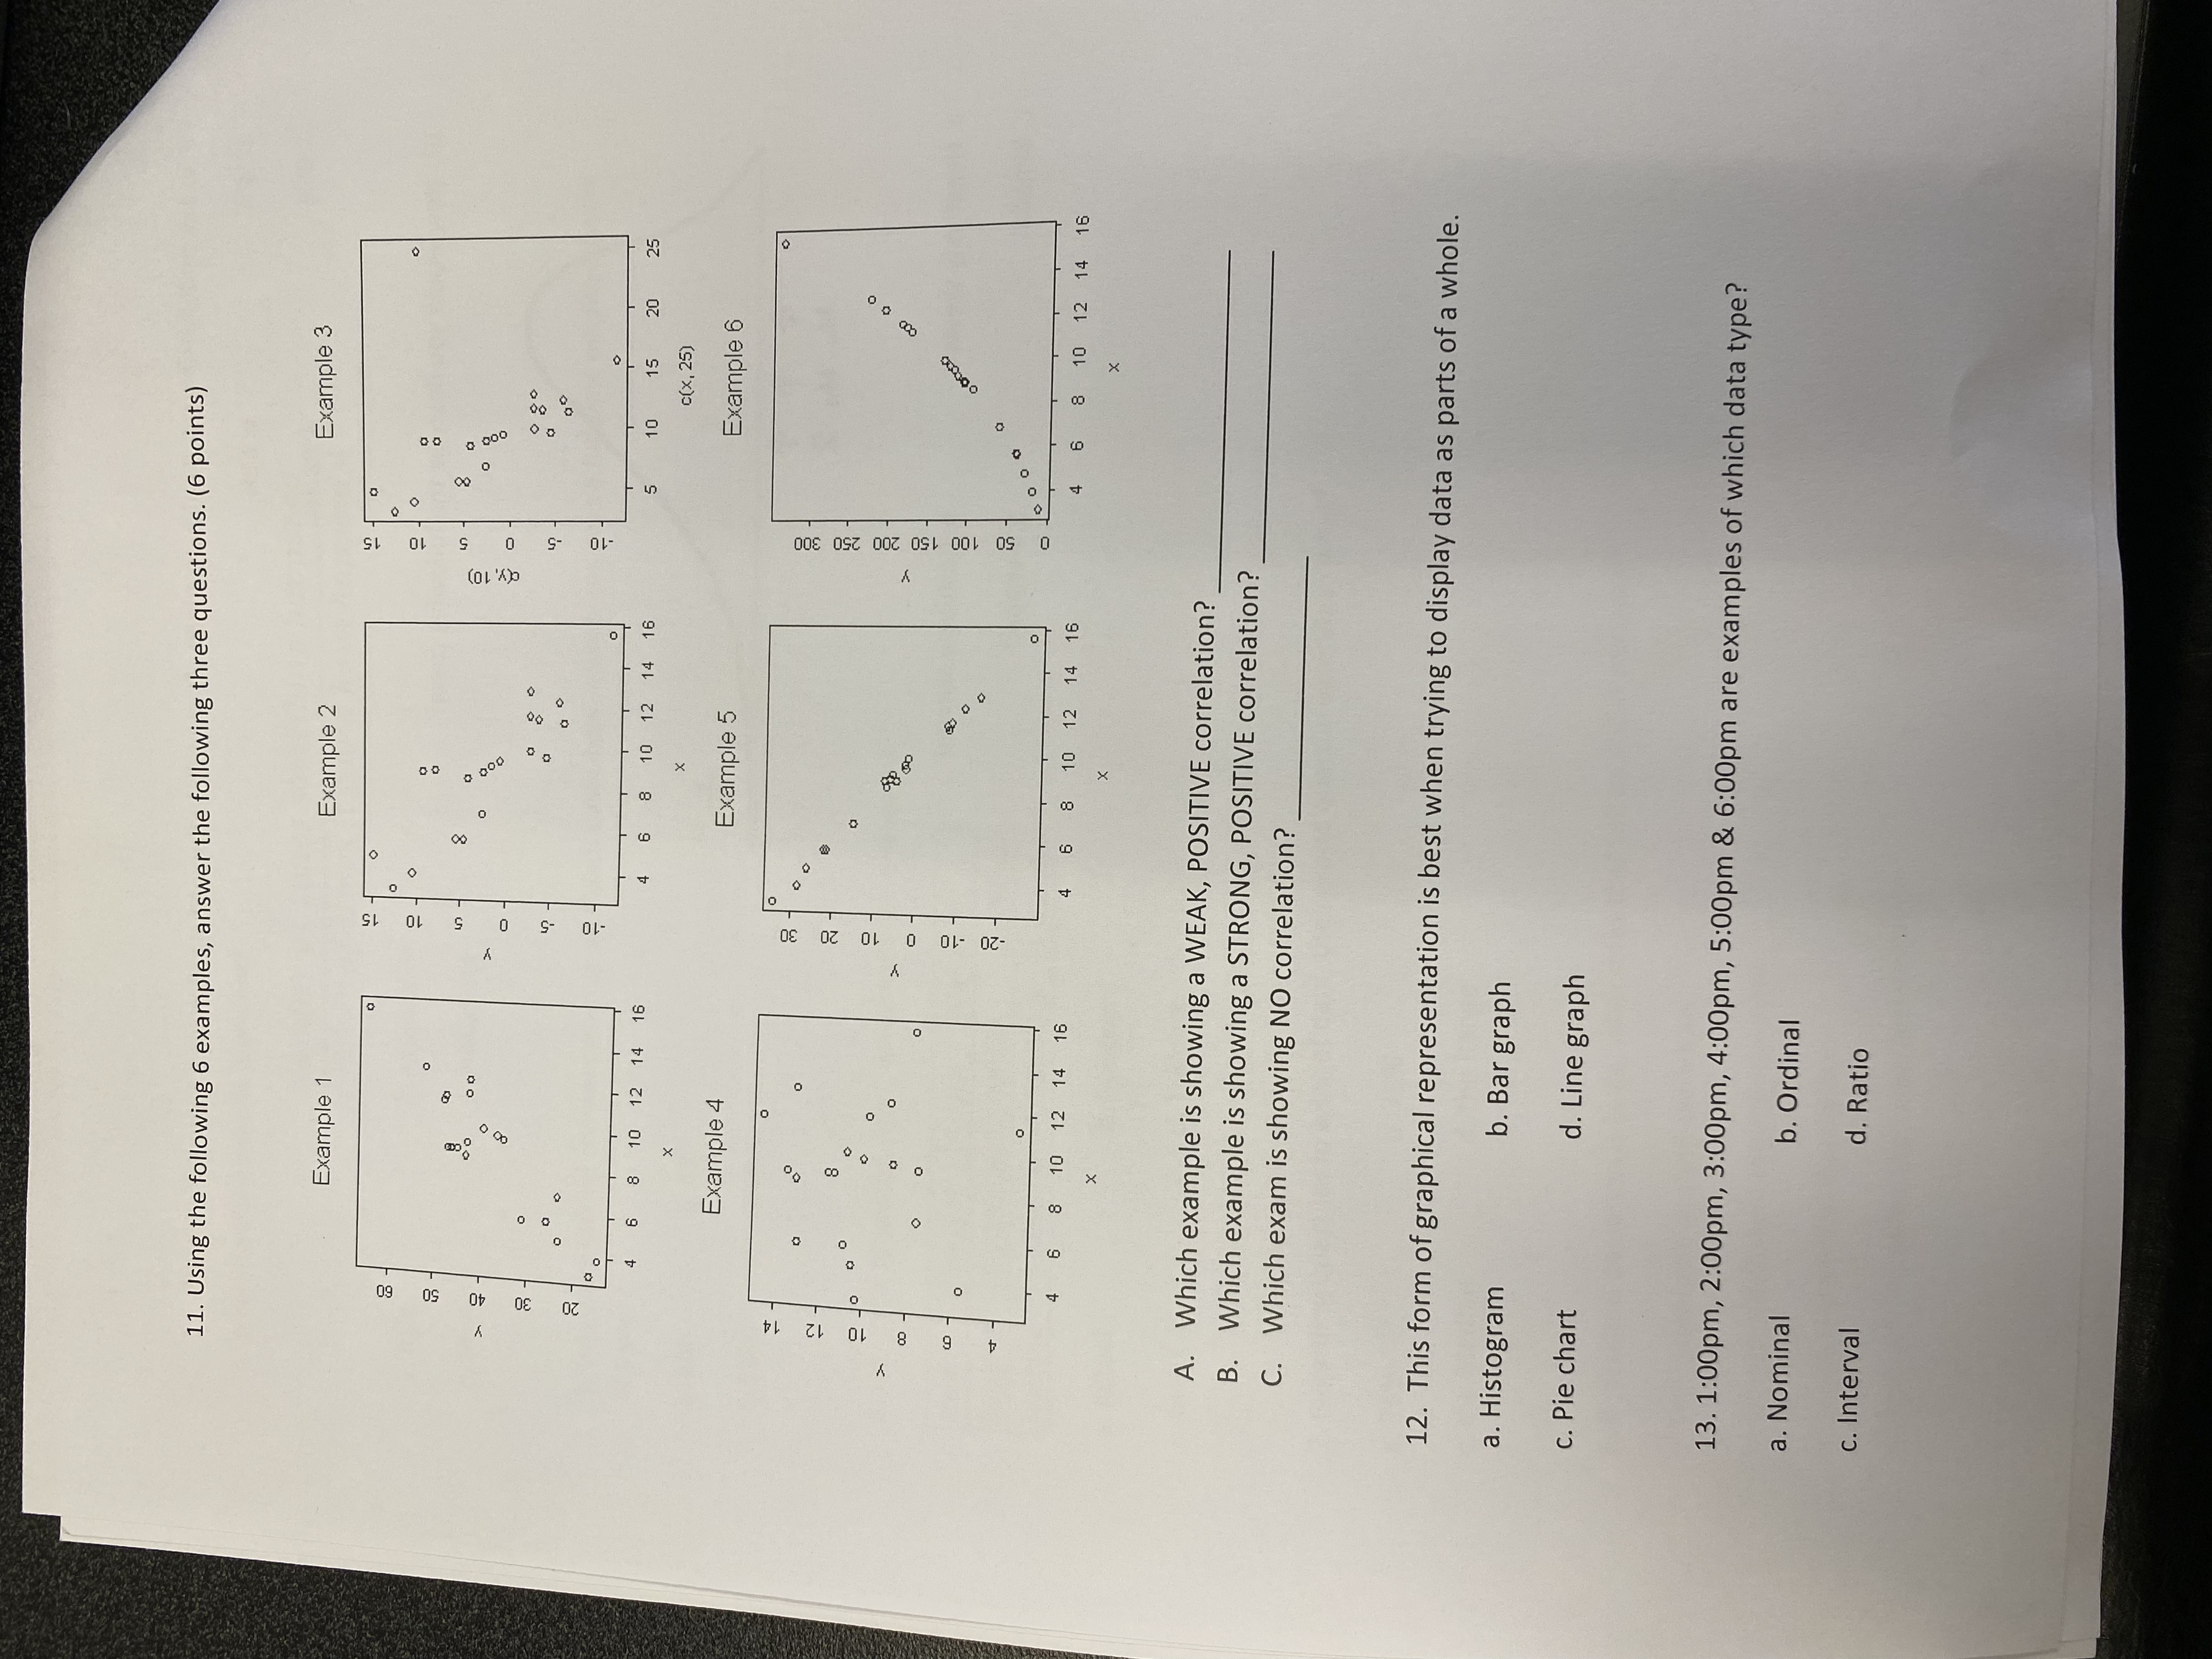
4. What does this formula represent? Number of times something happened Number of times it could have happened a. Rate b. Assumption c. Mystery d. Probability 5. When calculating compensation or unit labor costs, how many hours does a full-time employee work in a year? a. 365 b. 52 c. 2080 d. .3 6. Using the following chart, which variance is favorable? Item Budget Actual Variance Supplies $3,000.00 $2,000.00 $1,000.00 Training $3,000.00 $4,000.00 $ (1,000.00) a. Actual b. Budgeted c. Supplies d. Training 7. Regarding quartiles in a set of data, the second quartile extends to what? a. 25% b. 75% c. the Median d. the Range 8. If standard deviation is large, what does that tell us about our data? a. Less dispersion around the mean b. Greater dispersion around the mean c. We have a normal distribution d. Variance is smaller than standard deviation9. In a normal distribution, what percentage of data falls within one standard deviation of the mean? a. 50% b. 68% c. 95% d. 99.7% 10. How would you describe the following curve? + Mo Md X a. Negatively skewed b. Positively skewed c. Bimodal d. J-shaped11. Using the following 6 examples, answer the following three questions. (6 points) Example 2 Example 3 Example 1 L O 09 OL OS 40 ody, 10) 0 30 S- S- -10 6 8 10 12 14 16 6 8 10 12 14 16 10 (X, 25) Example 4 Example 5 Example 6 Or 0Z 10 12 01 0 50 100 150 200 250 300 O OL- 9 O 20 6 8 10 12 14 16 6 8 10 12 14 16 4 8 10 12 14 16 X A. Which example is showing a WEAK, POSITIVE correlation? B. Which example is showing a STRONG, POSITIVE correlation? C. Which exam is showing NO correlation? 12. This form of graphical representation is best when trying to display data as parts of a whole a. Histogram b. Bar graph c. Pie chart d. Line graph 13. 1:00pm, 2:00pm, 3:00pm, 4:00pm, 5:00pm & 6:00pm are examples of which data type? a. Nominal b. Ordinal c. Interval d. RatioMultiple choice questions are worth 2 points each. The other questions are marked with each of their point values. You may use the provided spreadsheet to work on your calcuations (in addition to question 25). You may use a calculator. Please show as much work as you can. 1. This death rate excludes deaths that occur within 48 hours of admission. a. Gross death rate b) Net death rate c. Fetal death rate d. Postoperative death rate 2. Fetal death rate does not take into account which of the following? a. Early fetal death b. Intermediate fetal death c. Late fetal death d. Live births 3. Which autopsy rate is being calculated if it INCLUDES coroner and medical examiner cases? a. Mortality rate b. Gross autopsy rate c. Net autopsy rate d. Discharge occupancy ratio
Step by Step Solution
There are 3 Steps involved in it
Step: 1
Get Instant Access to Expert-Tailored Solutions
See step-by-step solutions with expert insights and AI powered tools for academic success
Step: 2
Step: 3
Ace Your Homework with AI
Get the answers you need in no time with our AI-driven, step-by-step assistance