Answered step by step
Verified Expert Solution
Link Copied!

Question

1 Approved Answer

4. What is (are) the mode(s) within your data set, if any? Is your data set unimodal, bimodal, trimodal, ...? What is the frequency of
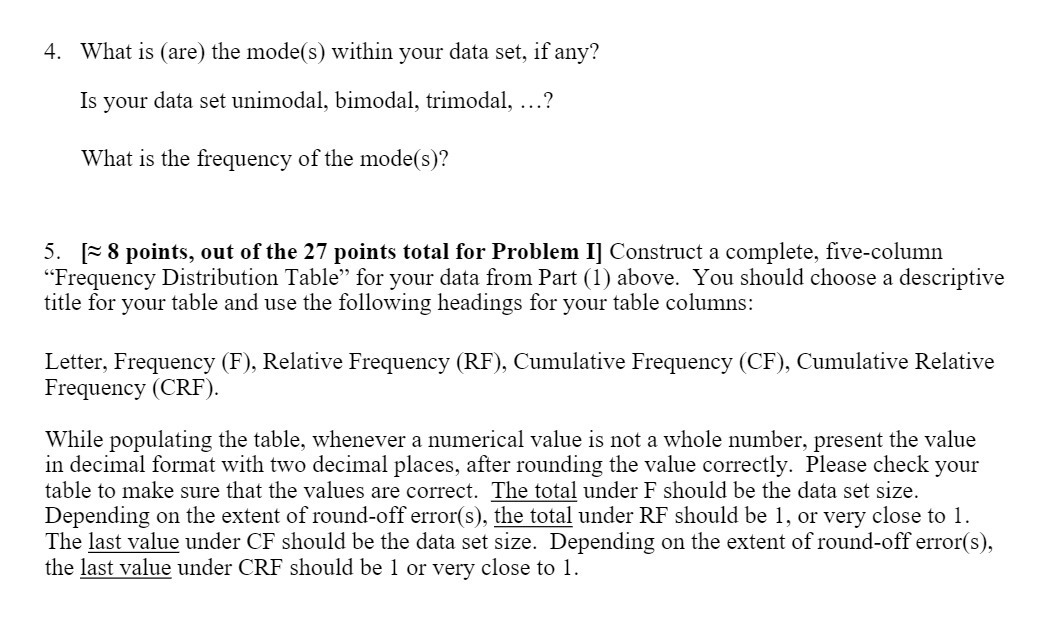
image text in transcribed
4. What is (are) the mode(s) within your data set, if any? Is your data set unimodal, bimodal, trimodal, ...? What is the frequency of the mode(s)? 5. [= 8 points, out of the 27 points total for Problem I] Construct a complete, ve-column \"Frequency Distribution Table\" for your data from Part (1) above. You should choose a descriptive title for your table and use the following headings for your table columns: Letter, Frequency (F), Relative Frequency (RF), Cumulative Frequency (CF), Cumulative Relative Frequency (CRF). While populating the table, whenever a numerical value is not a whole number, present the value in decimal format with two decimal places, after rounding the value correctly. Please check your table to make sure that the values are correct. The total under F should be the data set size. Depending on the extent of round-off error(s), the total under RF should be 1, or very close to 1. The last value under CF should be the data set size. Depending on the extent of round-off error(s), the last value under CRF should be 1 or very close to l

Step by Step Solution

There are 3 Steps involved in it

Step: 1

blur-text-image

Get Instant Access to Expert-Tailored Solutions

See step-by-step solutions with expert insights and AI powered tools for academic success

Step: 2

blur-text-image_2

Step: 3

blur-text-image_3

Ace Your Homework with AI

Get the answers you need in no time with our AI-driven, step-by-step assistance

Get Started

Recommended Textbook for

Introduction to Probability

Authors: Mark Daniel Ward, Ellen Gundlach

1st edition

716771098, 978-1319060893, 1319060897, 978-0716771098

More Books

Students also viewed these Mathematics questions