

Question
400 observations in a data set were partitioned by the 3-Means method and the following partial XLMiner output is available: Distance Between Centroids Cluster-1
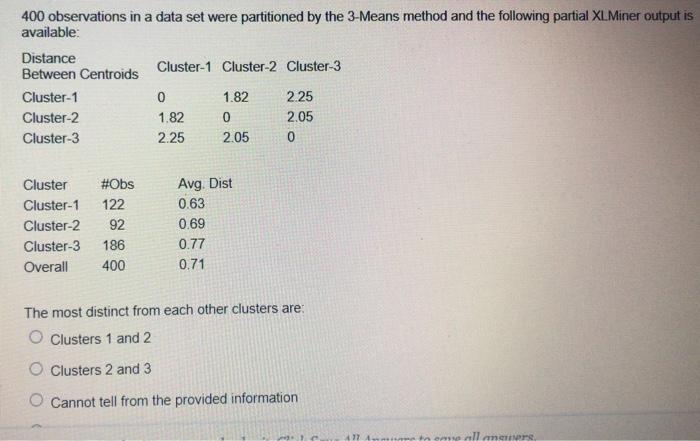
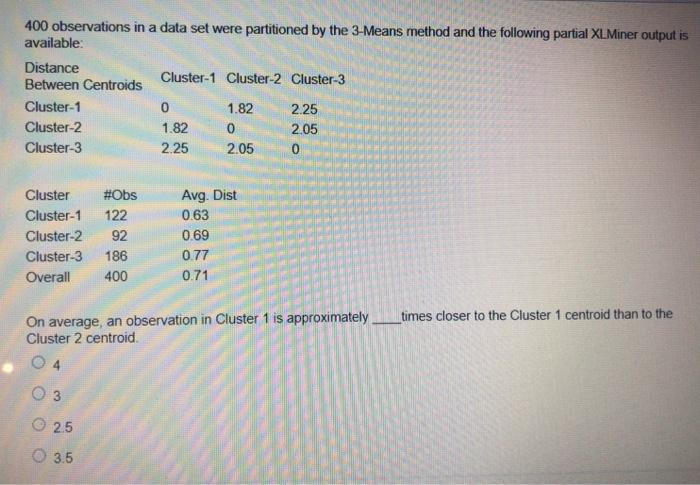
400 observations in a data set were partitioned by the 3-Means method and the following partial XLMiner output is available: Distance Between Centroids Cluster-1 Cluster-2 Cluster-3 Cluster #Obs Cluster-1 122 Cluster-2 92 Cluster-3 186 Overall 400 Cluster-1 Cluster-2 Cluster-3 0 1.82 2.25 1.82 0 2.05 Avg. Dist 0.63 0.69 0.77 0.71 2.25 2.05 0 The most distinct from each other clusters are: O Clusters 1 and 2 O Clusters 2 and 3 O Cannot tell from the provided information L.C. All Anmore to save all ansuers. 400 observations in a data set were partitioned by the 3-Means method and the following partial XLMiner output is available: Distance Between Centroids Cluster-1 Cluster-2 Cluster-3 Cluster #Obs Cluster-1 122 Cluster-2 92 Cluster-3 186 Overall 400 0 3 25 Cluster-1 Cluster-2 Cluster-3 3.5 0 1.82 2.25 1.82 0 2.05 Avg. Dist 0.63 0.69 0.77 0.71 On average, an observation in Cluster 1 is approximately Cluster 2 centroid. 2.25 2.05 0 times closer to the Cluster 1 centroid than to the
Step by Step Solution
3.56 Rating (160 Votes )
There are 3 Steps involved in it
Step: 1
Part 1 c Cannot tell from the ...
Get Instant Access to Expert-Tailored Solutions
See step-by-step solutions with expert insights and AI powered tools for academic success
Step: 2

Step: 3
Ace Your Homework with AI
Get the answers you need in no time with our AI-driven, step-by-step assistance
Get Started
Statistics For Management And Economics Abbreviated
Authors: Gerald Keller
10th Edition
978-1-305-0821, 1285869648, 1-305-08219-2, 978-1285869643