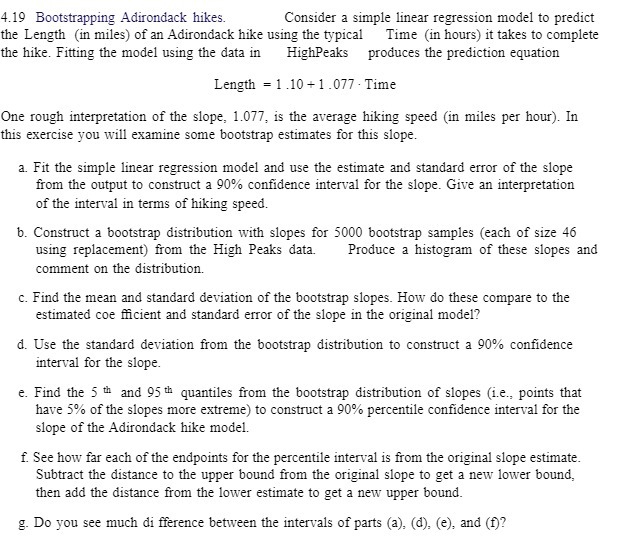
4.19 Bootstrapping Adirondack hikes. Consider a simple linear regression model to predict the Length (in miles) of an Adirondack hike using the typical Time (in hours) it takes to complete the hike. Fitting the model using the data in HighPeaks produces the prediction equation Length = 1 .10 +1.077 . Time One rough interpretation of the slope, 1.077, is the average hiking speed (in miles per hour). In this exercise you will examine some bootstrap estimates for this slope. a. Fit the simple linear regression model and use the estimate and standard error of the slope from the output to construct a 90% confidence interval for the slope. Give an interpretation of the interval in terms of hiking speed. b. Construct a bootstrap distribution with slopes for 5000 bootstrap samples (each of size 46 using replacement) from the High Peaks data. Produce a histogram of these slopes and comment on the distribution. c. Find the mean and standard deviation of the bootstrap slopes. How do these compare to the estimated coe flicient and standard error of the slope in the original model? d. Use the standard deviation from the bootstrap distribution to construct a 90% confidence interval for the slope. e. Find the 5 th and 95 th quantiles from the bootstrap distribution of slopes (i.e., points that have 5% of the slopes more extreme) to construct a 90% percentile confidence interval for the slope of the Adirondack hike model. f. See how far each of the endpoints for the percentile interval is from the original slope estimate. Subtract the distance to the upper bound from the original slope to get a new lower bound, then add the distance from the lower estimate to get a new upper bound. g. Do you see much difference between the intervals of parts (a), (d), (e), and (f)