Answered step by step
Verified Expert Solution
Question
1 Approved Answer
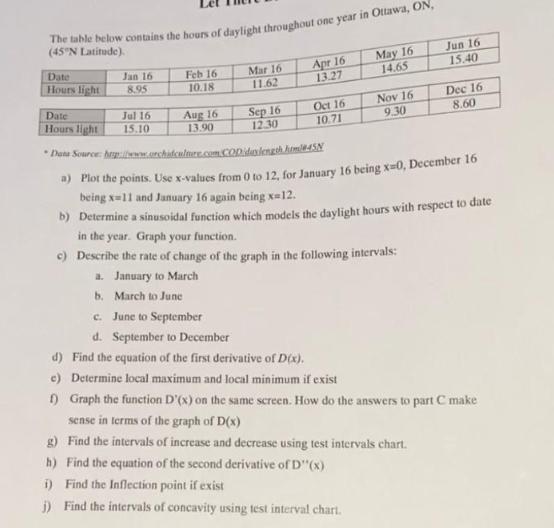
The table below contains the hours of daylight throughout one year in Ottawa, ON, (45N Latitude). Date Hours light Jan 16 8.95 Jul 16

The table below contains the hours of daylight throughout one year in Ottawa, ON, (45"N Latitude). Date Hours light Jan 16 8.95 Jul 16 15.10 Feb 16 10.18 Aug 16 13.90 Mar 16 11.62 Sep 16 12.30 Apr 16 13.27 Oct 16 10.71 May 16 14.65 Nov 16 9.30 Jun 16 15.40 in the year. Graph your function. c) Describe the rate of change of the graph in the following intervals: a. January to March b. March to June c. June to September d. September to December d) Find the equation of the first derivative of D(x). e) Determine local maximum and local minimum if exist Dec 16 8.60 Date Hours light Data Source: http:www.orchidcelmere.com.Copidaxlength.Arm445N a) Plot the points. Use x-values from 0 to 12, for January 16 being x=0, December 16 being x-11 and January 16 again being x-12. b) Determine a sinusoidal function which models the daylight hours with respect to date f) Graph the function D'(x) on the same screen. How do the answers to part C make sense in terms of the graph of D(x) g) Find the intervals of increase and decrease using test intervals chart. h) Find the equation of the second derivative of D"(x) i) Find the Inflection point if exist j) Find the intervals of concavity using test interval chart.
Step by Step Solution
★★★★★
3.41 Rating (167 Votes )
There are 3 Steps involved in it
Step: 1
a Plot the points Use xvalues from 0 to 12 for January 16 being x0 December 16 being x11 and January 16 again being x12 b Determine a sinusoidal function which models the daylight hours with respect t...
Get Instant Access to Expert-Tailored Solutions
See step-by-step solutions with expert insights and AI powered tools for academic success
Step: 2

Step: 3

Ace Your Homework with AI
Get the answers you need in no time with our AI-driven, step-by-step assistance
Get Started


