

Answered step by step
Verified Expert Solution
Question
1 Approved Answer
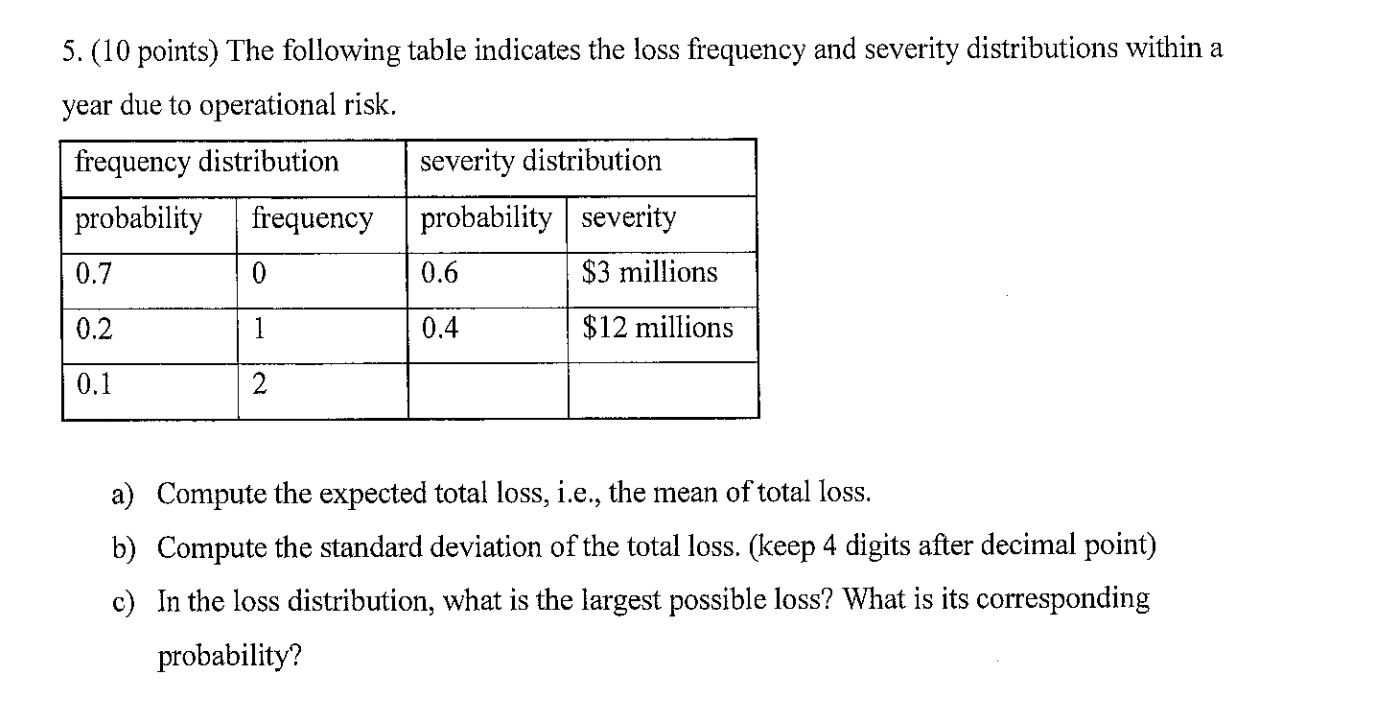
5. (10 points) The following table indicates the loss frequency and severity distributions within a year due to operational risk. a) Compute the expected total
Step by Step Solution
There are 3 Steps involved in it
Step: 1

Get Instant Access to Expert-Tailored Solutions
See step-by-step solutions with expert insights and AI powered tools for academic success
Step: 2

Step: 3
Ace Your Homework with AI
Get the answers you need in no time with our AI-driven, step-by-step assistance
Get Started
Quantitative Corporate Finance
Authors: John B. Guerard Jr. Anureet Saxena, Mustafa Gultekin
2nd Edition
3030435466, 978-3030435462