

Answered step by step
Verified Expert Solution
Question
1 Approved Answer
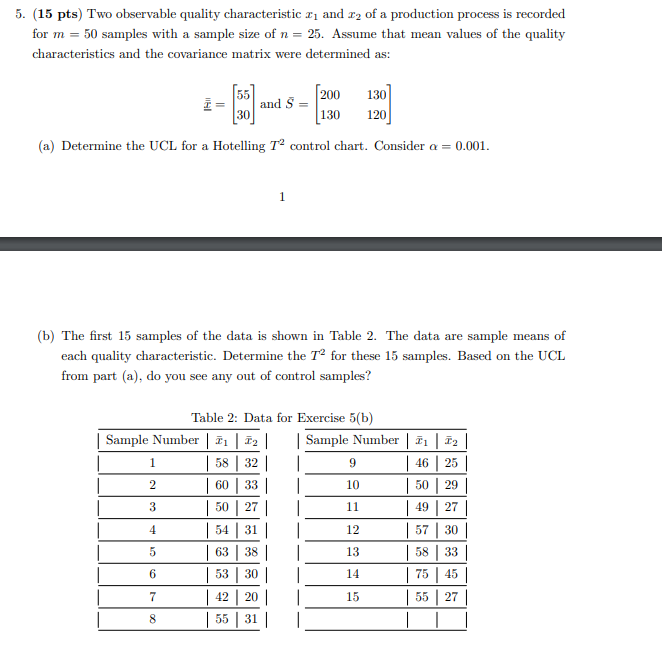
5. (15 pts) Two observable quality characteristic z1 and r2 of a production process is recorded for m = 50 samples with a sample size
Step by Step Solution
There are 3 Steps involved in it
Step: 1

Get Instant Access to Expert-Tailored Solutions
See step-by-step solutions with expert insights and AI powered tools for academic success
Step: 2

Step: 3
Ace Your Homework with AI
Get the answers you need in no time with our AI-driven, step-by-step assistance
Get Started
Precalculus
Authors: J Douglas Faires, Charles H Gibson, James DeFranza
5th Edition
1133172547, 9781133172543