Question
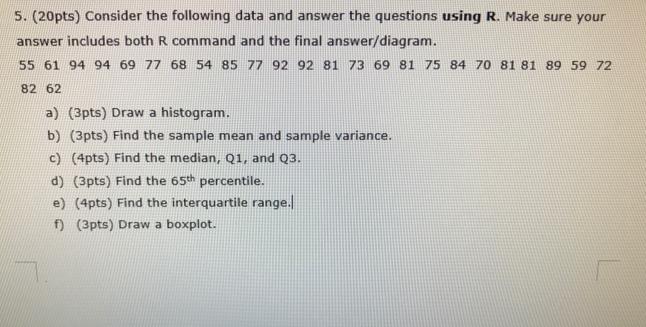
5. (20pts) Consider the following data and answer the questions using R. Make sure your answer includes both R command and the final answer/diagram.

5. (20pts) Consider the following data and answer the questions using R. Make sure your answer includes both R command and the final answer/diagram. 55 61 94 94 69 77 68 54 85 77 92 92 81 73 69 81 75 84 70 81 81 89 59 72 82 62 a) (3pts) Draw a histogram. b) (3pts) Find the sample mean and sample variance. c) (4pts) Find the median, Q1, and Q3. d) (3pts) Find the 65th percentile. e) (4pts) Find the interquartile range. f) (3pts) Draw a boxplot.
Step by Step Solution
3.60 Rating (157 Votes )
There are 3 Steps involved in it
Step: 1
Certainly It looks like you need assistance with ...
Get Instant Access to Expert-Tailored Solutions
See step-by-step solutions with expert insights and AI powered tools for academic success
Step: 2

Step: 3

Ace Your Homework with AI
Get the answers you need in no time with our AI-driven, step-by-step assistance
Get StartedRecommended Textbook for
Statistics
Authors: Robert S. Witte, John S. Witte
11th Edition
1119254515, 978-1119254515
Students also viewed these Programming questions
Question
Answered: 1 week ago
Question
Answered: 1 week ago
Question
Answered: 1 week ago
Question
Answered: 1 week ago
Question
Answered: 1 week ago
Question
Answered: 1 week ago
Question
Answered: 1 week ago
Question
Answered: 1 week ago
Question
Answered: 1 week ago
Question
Answered: 1 week ago
Question
Answered: 1 week ago
Question
Answered: 1 week ago
Question
Answered: 1 week ago
Question
Answered: 1 week ago
Question
Answered: 1 week ago
Question
Answered: 1 week ago
Question
Answered: 1 week ago
Question
Answered: 1 week ago
Question
Answered: 1 week ago
Question
Answered: 1 week ago
Question
Answered: 1 week ago
Question
Answered: 1 week ago
Question
Answered: 1 week ago
View Answer in SolutionInn App


