Question
5. A large department store has collected the following monthly data on lost sales revenue due to theft and the number of security guard

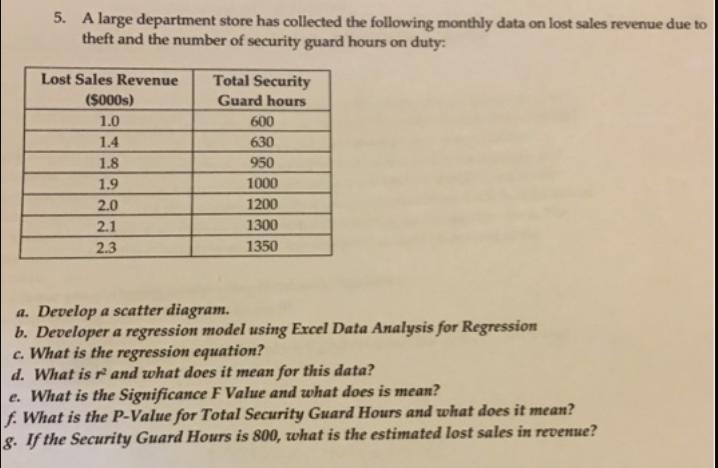
5. A large department store has collected the following monthly data on lost sales revenue due to theft and the number of security guard hours on duty: Lost Sales Revenue Total Security (S000s) Guard hours 1.0 600 1.4 630 1.8 950 1.9 1000 2.0 1200 2.1 1300 2.3 1350 a. Develop a scatter diagram. b. Developer a regression model using Excel Data Analysis for Regression c. What is the regression equation? d. What is r and what does it mean for this data? e. What is the Significance F Value and what does is mean? f. What is the P-Value for Total Security Guard Hours and what does it mean? g. If the Security Guard Hours is 800, what is the estimated lost sales in revenue?
Step by Step Solution
3.39 Rating (149 Votes )
There are 3 Steps involved in it
Step: 1

Get Instant Access to Expert-Tailored Solutions
See step-by-step solutions with expert insights and AI powered tools for academic success
Step: 2

Step: 3

Ace Your Homework with AI
Get the answers you need in no time with our AI-driven, step-by-step assistance
Get StartedRecommended Textbook for
Managerial Economics
Authors: William F. Samuelson, Stephen G. Marks
8th edition
1118808940, 978-1119025900, 1119025907, 978-1119025924, 978-1118808948
Students also viewed these Economics questions
Question
Answered: 1 week ago
Question
Answered: 1 week ago
Question
Answered: 1 week ago
Question
Answered: 1 week ago
Question
Answered: 1 week ago
Question
Answered: 1 week ago
Question
Answered: 1 week ago
Question
Answered: 1 week ago
Question
Answered: 1 week ago
Question
Answered: 1 week ago
Question
Answered: 1 week ago
Question
Answered: 1 week ago
Question
Answered: 1 week ago
Question
Answered: 1 week ago
Question
Answered: 1 week ago
Question
Answered: 1 week ago
Question
Answered: 1 week ago
Question
Answered: 1 week ago
Question
Answered: 1 week ago
Question
Answered: 1 week ago
View Answer in SolutionInn App


