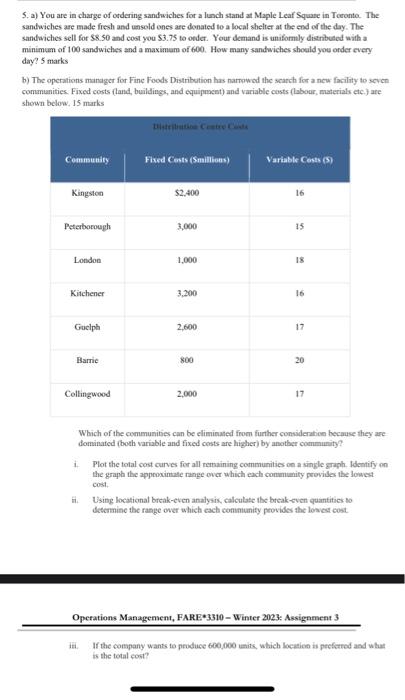
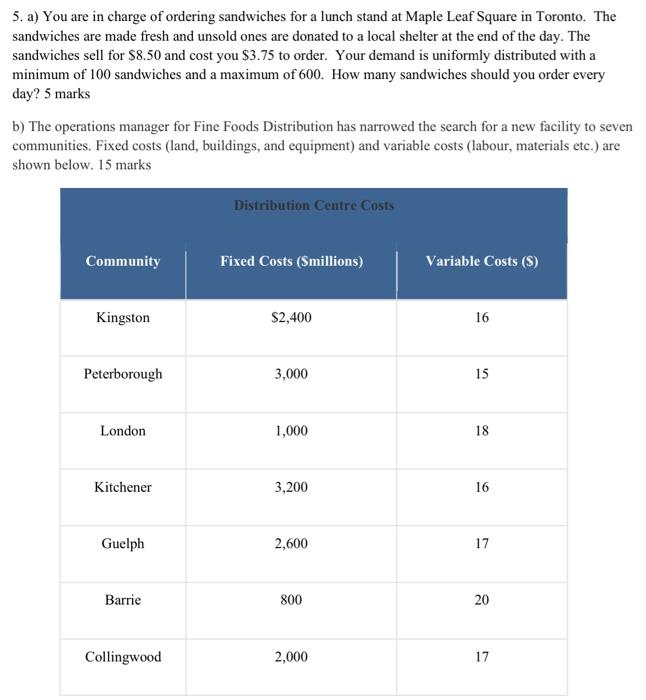
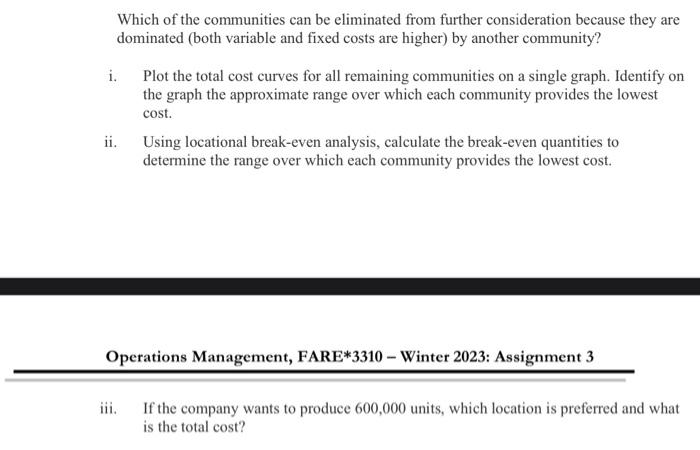
5. a) You are in charge of ordering sandwiches for a lunch stand at Maple Leaf Squase in Teronte. The sandwiches ase made fresh and unsold ones are donated to a local shelter at the end of the dry. The sandwiches sell for $8.50 and cost you 53.75 to onder. Your dcmand is uniformly distribued with a minimum of 100 sandwiches and a maximum of 600 . How many sandwiches should you order every day? 5 marks b) The openitions manager for Fine Foods Distribution has narmpwod the search for a new facility to seven communities. Fixed costs (land, buildings, and equipment) and variable costs (labour, materials ete.) are shown below. 15 marks Which of the communities can be eliminuted from further convideration becmuse they are dominated (both variable and fixed costs are higher) by another community? i. Plot the total cost curves for all remaining communities on a single graph. Identify on the graph the appeoximtate range over which each conmunity grovides the lowest cosi. i. Using locational break-even analysis, calculate ibe break-even quantities to deternine the range over which each conntunity provides the lowed cost Operations Managenen, FARE*3310 - Winter 2023: Assignment 3 ii. If the company wants to pruduee 600,000 inits, which locutice is pecferrod and what is the total cont? 5. a) You are in charge of ordering sandwiches for a lunch stand at Maple Leaf Square in Toronto. The sandwiches are made fresh and unsold ones are donated to a local shelter at the end of the day. The sandwiches sell for $8.50 and cost you $3.75 to order. Your demand is uniformly distributed with a minimum of 100 sandwiches and a maximum of 600 . How many sandwiches should you order every day? 5 marks b) The operations manager for Fine Foods Distribution has narrowed the search for a new facility to seven communities. Fixed costs (land, buildings, and equipment) and variable costs (labour, materials etc.) are shown below. 15 marks Which of the communities can be eliminated from further consideration because they are dominated (both variable and fixed costs are higher) by another community? i. Plot the total cost curves for all remaining communities on a single graph. Identify on the graph the approximate range over which each community provides the lowest cost. ii. Using locational break-even analysis, calculate the break-even quantities to determine the range over which each community provides the lowest cost. Operations Management, FARE*3310 - Winter 2023: Assignment 3 iii. If the company wants to produce 600,000 units, which location is preferred and what is the total cost


