

Answered step by step
Verified Expert Solution
Question
1 Approved Answer
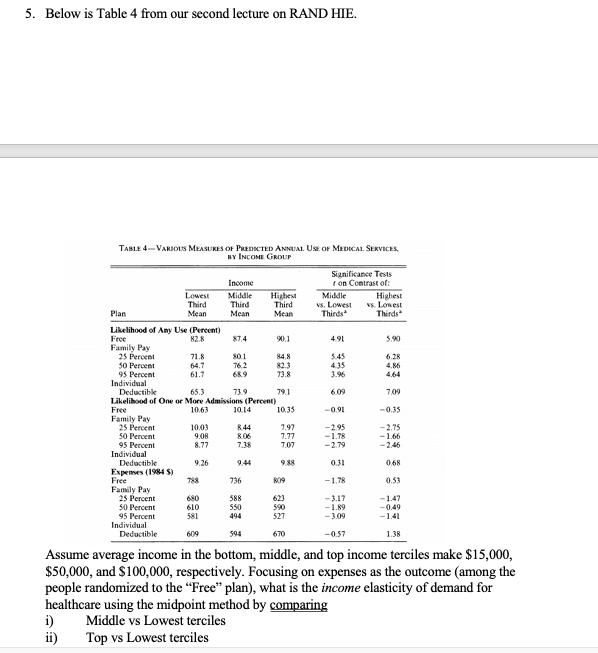
5. Below is Table 4 from our second lecture on RAND HIE. TABLE 4- VARIOUS MEASURES OF PREDICTED ANNUAL USE OF MEDICAL SERVICES, BY INCOME

Step by Step Solution
There are 3 Steps involved in it
Step: 1

Get Instant Access to Expert-Tailored Solutions
See step-by-step solutions with expert insights and AI powered tools for academic success
Step: 2

Step: 3
Ace Your Homework with AI
Get the answers you need in no time with our AI-driven, step-by-step assistance
Get Started
Essentials Of Economics
Authors: Bradley Schiller
7th Edition
0073375802, 9780073375809