

Question: 5. By using Excel or GoogleSheets, graph the Lineweaver-Burk plots for the behavior of an enzyme for which the following experimental data are available.
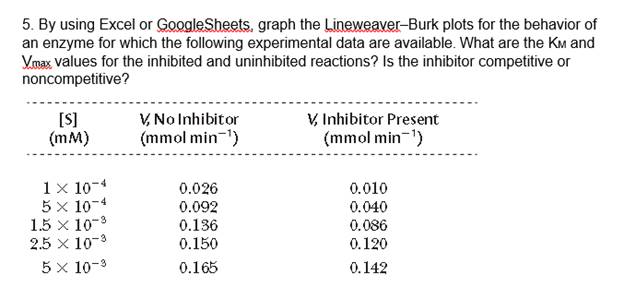
5. By using Excel or GoogleSheets, graph the Lineweaver-Burk plots for the behavior of an enzyme for which the following experimental data are available. What are the KM and Vmax values for the inhibited and uninhibited reactions? Is the inhibitor competitive or noncompetitive? [S] (mM) V, No Inhibitor (mmol min-) V, Inhibitor Present (mmol min-) 1x 10 5 x 10⁻⁴ 1.5 x 10⁻³ 2.5 x 10⁻³ 0.026 0.092 0.010 0.040 0.086 0.136 0.150 0.120 5x 10⁻³ 0.165 0.142
Step by Step Solution
3.33 Rating (144 Votes )
There are 3 Steps involved in it
Answer According to the given question iWe know that the Michelis Menten Equation Vo Vmax S Km ... View full answer

Get step-by-step solutions from verified subject matter experts