

Answered step by step
Verified Expert Solution
Question
1 Approved Answer
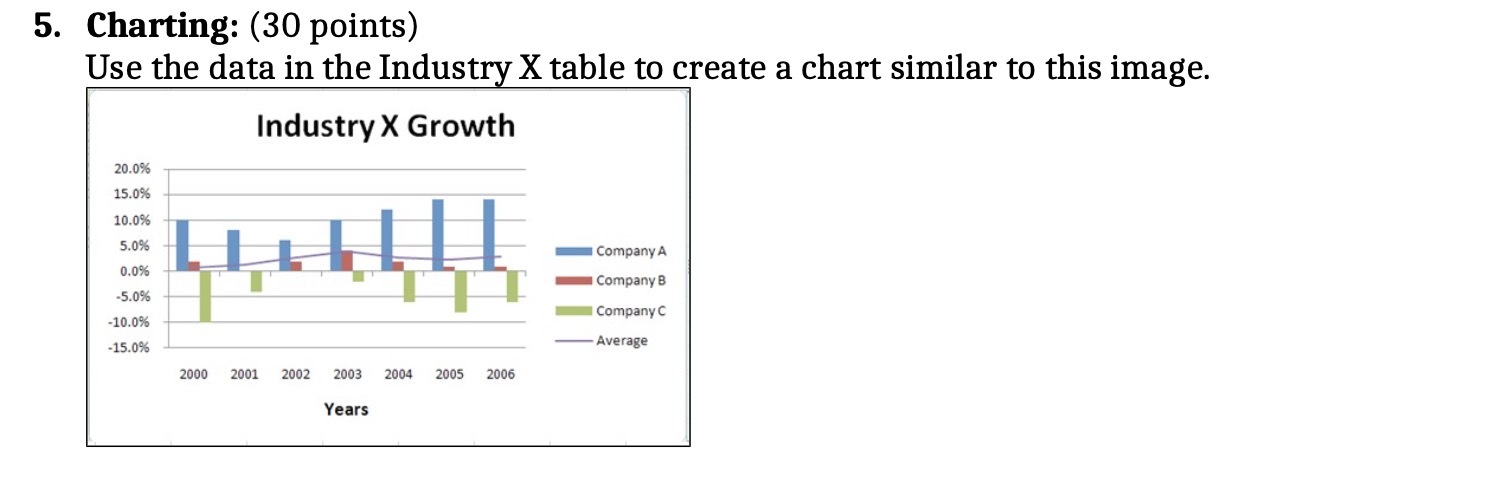
5. Charting: (30 points) Use the data in the Industry X table to create a chart similar to this image. Industry X Growth 20.0% 15.0%

Step by Step Solution
There are 3 Steps involved in it
Step: 1

Get Instant Access to Expert-Tailored Solutions
See step-by-step solutions with expert insights and AI powered tools for academic success
Step: 2

Step: 3
Ace Your Homework with AI
Get the answers you need in no time with our AI-driven, step-by-step assistance
Get Started
Foundations Of Financial Management
Authors: Stanley Block, Geoffrey Hirt, Bartley Danielsen, Doug Short, Michael Perretta
11th Canadian Edition
1259024970, 978-1259265921