

Answered step by step
Verified Expert Solution
Question
1 Approved Answer
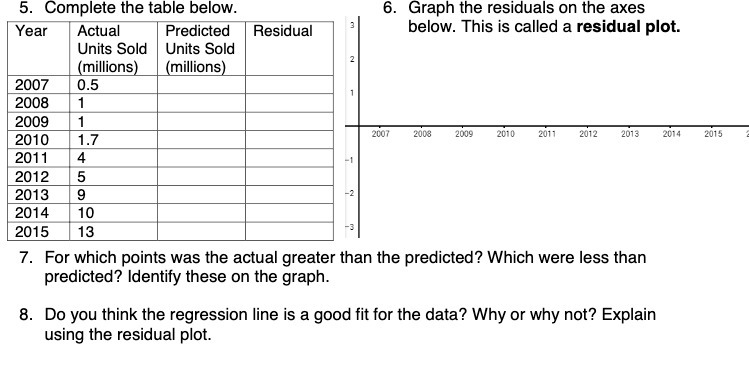
5. Complete the table below. 6. Graph the residuals on the axes Year Actual Predicted Residual below. This is called a residual plot. Units Sold
Step by Step Solution
There are 3 Steps involved in it
Step: 1

Get Instant Access to Expert-Tailored Solutions
See step-by-step solutions with expert insights and AI powered tools for academic success
Step: 2

Step: 3
Ace Your Homework with AI
Get the answers you need in no time with our AI-driven, step-by-step assistance
Get Started
Advanced Engineering Mathematics
Authors: Erwin Kreyszig
10th edition
470458364, 470458365, 978-0470458365