

Answered step by step
Verified Expert Solution
Question
1 Approved Answer
5. Consider the MA(4) model with p = a) Sketch the ACF plot. 0.8, P2 = 0.6, p = 0.4 and p4 = 0.2.
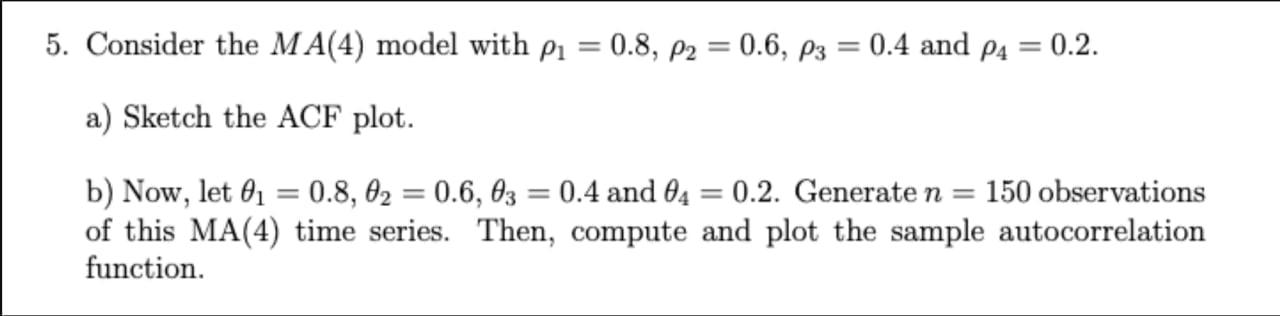
5. Consider the MA(4) model with p = a) Sketch the ACF plot. 0.8, P2 = 0.6, p = 0.4 and p4 = 0.2. b) Now, let 10.8, 0 = 0.6, 03 = 0.4 and 04 0.2. Generate n = 150 observations of this MA(4) time series. Then, compute and plot the sample autocorrelation function.
Step by Step Solution
There are 3 Steps involved in it
Step: 1

Get Instant Access to Expert-Tailored Solutions
See step-by-step solutions with expert insights and AI powered tools for academic success
Step: 2

Step: 3
Ace Your Homework with AI
Get the answers you need in no time with our AI-driven, step-by-step assistance
Get Started
Financial and Managerial Accounting
Authors: Carl S. Warren, James M. Reeve, Jonathan Duchac
12th edition
978-1133952428, 1285078578, 1133952429, 978-1285078571