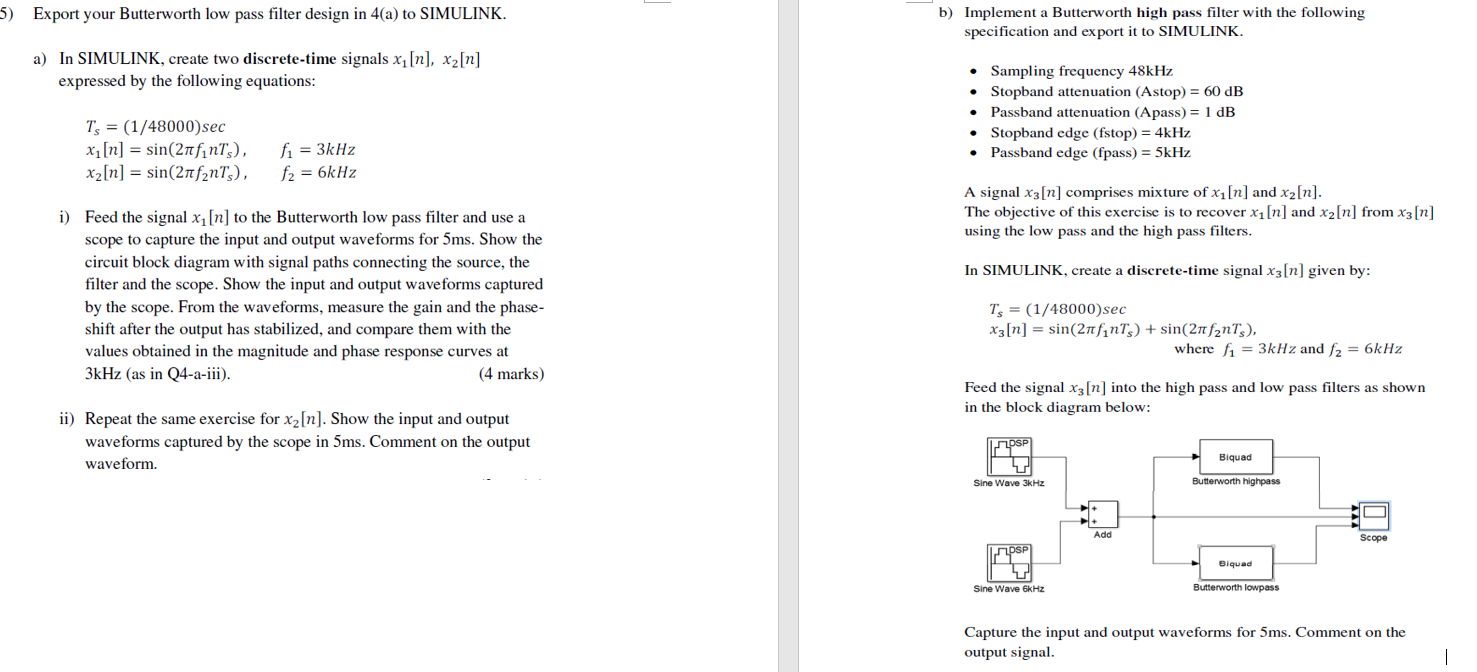
5) Export your Butterworth low pass filter design in 4(a) to SIMULINK. b) Implement a Butterworth high pass filter with the following specification and export it to SIMULINK. a) In SIMULINK, create two discrete-time signals x1 [n], x2[n] expressed by the following equations: Sampling frequency 48kHz Stopband attenuation (Astop) = 60 dB Passband attenuation (Apass) = 1 dB Stopband edge (fstop) = 4kHz Passband edge (fpass) = 5kHz Ts = (1/48000) sec x1[n] = sin(2nfint), X2[n] = sin(2nfants), fi = 3kHz f2 = 6kHz A signal x3[n] comprises mixture of x1[n] and x2[n]. The objective of this exercise is to recover x1 [n] and x2[n] from x3[n] using the low pass and the high pass filters. In SIMULINK, create a discrete-time signal x3[n] given by: i) Feed the signal x[n] to the Butterworth low pass filter and use a scope to capture the input and output waveforms for 5ms. Show the circuit block diagram with signal paths connecting the source, the filter and the scope. Show the input and output waveforms captured by the scope. From the waveforms, measure the gain and the phase- shift after the output has stabilized, and compare them with the values obtained in the magnitude and phase response curves at 3kHz (as in Q4-a-iii). (4 marks) Ts = (1/48000sec x3[n] = sin(2tfints) + sin(2t funts), where fi = 3kHz and /2 = 6kHz Feed the signal xz [n] into the high pass and low pass filters as shown in the block diagram below: ii) Repeat the same exercise for x2 [n]. Show the input and output waveforms captured by the scope in 5ms. Comment on the output waveform. SP Biquad Sine Wave 3kHz Butterworth highpass Scope psp Biquad Sine Wave 6kHz Butterworth lowpass Capture the input and output waveforms for 5ms. Comment on the output signal. 5) Export your Butterworth low pass filter design in 4(a) to SIMULINK. b) Implement a Butterworth high pass filter with the following specification and export it to SIMULINK. a) In SIMULINK, create two discrete-time signals x1 [n], x2[n] expressed by the following equations: Sampling frequency 48kHz Stopband attenuation (Astop) = 60 dB Passband attenuation (Apass) = 1 dB Stopband edge (fstop) = 4kHz Passband edge (fpass) = 5kHz Ts = (1/48000) sec x1[n] = sin(2nfint), X2[n] = sin(2nfants), fi = 3kHz f2 = 6kHz A signal x3[n] comprises mixture of x1[n] and x2[n]. The objective of this exercise is to recover x1 [n] and x2[n] from x3[n] using the low pass and the high pass filters. In SIMULINK, create a discrete-time signal x3[n] given by: i) Feed the signal x[n] to the Butterworth low pass filter and use a scope to capture the input and output waveforms for 5ms. Show the circuit block diagram with signal paths connecting the source, the filter and the scope. Show the input and output waveforms captured by the scope. From the waveforms, measure the gain and the phase- shift after the output has stabilized, and compare them with the values obtained in the magnitude and phase response curves at 3kHz (as in Q4-a-iii). (4 marks) Ts = (1/48000sec x3[n] = sin(2tfints) + sin(2t funts), where fi = 3kHz and /2 = 6kHz Feed the signal xz [n] into the high pass and low pass filters as shown in the block diagram below: ii) Repeat the same exercise for x2 [n]. Show the input and output waveforms captured by the scope in 5ms. Comment on the output waveform. SP Biquad Sine Wave 3kHz Butterworth highpass Scope psp Biquad Sine Wave 6kHz Butterworth lowpass Capture the input and output waveforms for 5ms. Comment on the output signal