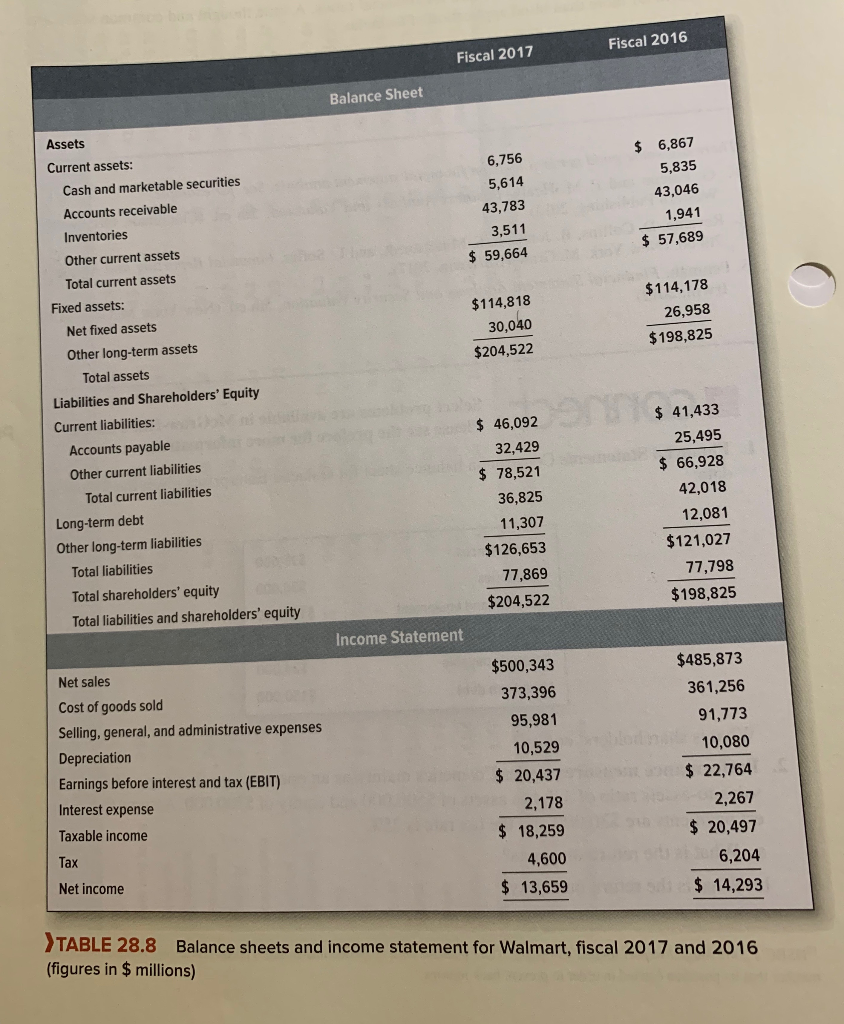

5. Financial ratios* Look again at Table 28.8, which gives abbreviated balance sheets and income statements for Walmart. Assume Walmart had a 35% marginal corporate tax rate in 2017. Calculate the following using balance-sheet figures from the start of the year: a. Return on assets. b. Operating profit margin. c. Sales-to-assets ratio. d. Inventory turnover. e. Debt-equity ratio. f. Current ratio. g. Quick ratio. Fiscal 2016 Fiscal 2017 Balance Sheet $ 6,867 5,835 43,046 6,756 5,614 43,783 3,511 $ 59,664 1,941 $ 57,689 $114,178 $114,818 30,040 $204,522 26,958 $198,825 Assets Current assets: Cash and marketable securities Accounts receivable Inventories Other current assets Total current assets Fixed assets: Net fixed assets Other long-term assets Total assets Liabilities and Shareholders' Equity Current liabilities: Accounts payable Other current liabilities Total current liabilities Long-term debt Other long-term liabilities Total liabilities Total shareholders' equity Total liabilities and shareholders' equity $ 46,092 32,429 $ 78,521 36,825 11,307 $126,653 77,869 $204,522 $ 41,433 25,495 $ 66,928 42,018 12,081 $121,027 77,798 $198,825 Income Statement Net sales Cost of goods sold Selling, general, and administrative expenses Depreciation Earnings before interest and tax (EBIT) Interest expense Taxable income Tax Net income $500,343 373,396 95,981 10,529 $ 20,437 2,178 $ 18,259 4,600 $ 13,659 $485,873 361,256 91,773 10,080 $ 22,764 2,267 $ 20,497 6,204 $ 14,293 TABLE 28.8 Balance sheets and income statement for Walmart, fiscal 2017 and 2016 (figures in $ millions) 5. Financial ratios* Look again at Table 28.8, which gives abbreviated balance sheets and income statements for Walmart. Assume Walmart had a 35% marginal corporate tax rate in 2017. Calculate the following using balance-sheet figures from the start of the year: a. Return on assets. b. Operating profit margin. c. Sales-to-assets ratio. d. Inventory turnover. e. Debt-equity ratio. f. Current ratio. g. Quick ratio. Fiscal 2016 Fiscal 2017 Balance Sheet $ 6,867 5,835 43,046 6,756 5,614 43,783 3,511 $ 59,664 1,941 $ 57,689 $114,178 $114,818 30,040 $204,522 26,958 $198,825 Assets Current assets: Cash and marketable securities Accounts receivable Inventories Other current assets Total current assets Fixed assets: Net fixed assets Other long-term assets Total assets Liabilities and Shareholders' Equity Current liabilities: Accounts payable Other current liabilities Total current liabilities Long-term debt Other long-term liabilities Total liabilities Total shareholders' equity Total liabilities and shareholders' equity $ 46,092 32,429 $ 78,521 36,825 11,307 $126,653 77,869 $204,522 $ 41,433 25,495 $ 66,928 42,018 12,081 $121,027 77,798 $198,825 Income Statement Net sales Cost of goods sold Selling, general, and administrative expenses Depreciation Earnings before interest and tax (EBIT) Interest expense Taxable income Tax Net income $500,343 373,396 95,981 10,529 $ 20,437 2,178 $ 18,259 4,600 $ 13,659 $485,873 361,256 91,773 10,080 $ 22,764 2,267 $ 20,497 6,204 $ 14,293 TABLE 28.8 Balance sheets and income statement for Walmart, fiscal 2017 and 2016 (figures in $ millions)


