

Answered step by step
Verified Expert Solution
Question
1 Approved Answer
5. Find the expected value for the random variable x having the probability function shown in the graph. AP 0.3- 0.25- 0.2- 0.15- 0.1-
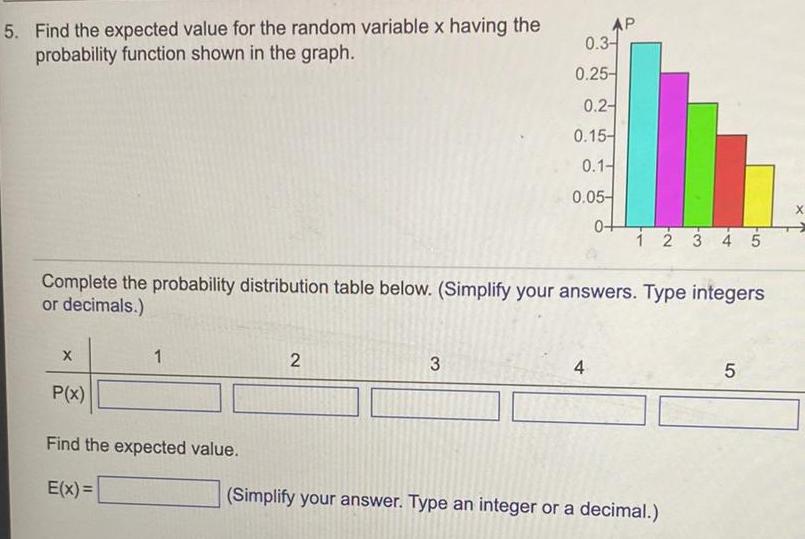
5. Find the expected value for the random variable x having the probability function shown in the graph. AP 0.3- 0.25- 0.2- 0.15- 0.1- 0.05- 0+ 1 2 3 4 5 Complete the probability distribution table below. (Simplify your answers. Type integers or decimals.) X 1 2 3 4 P(x) Find the expected value. E(x)= (Simplify your answer. Type an integer or a decimal.) 5 X
Step by Step Solution
There are 3 Steps involved in it
Step: 1

Get Instant Access to Expert-Tailored Solutions
See step-by-step solutions with expert insights and AI powered tools for academic success
Step: 2

Step: 3
Ace Your Homework with AI
Get the answers you need in no time with our AI-driven, step-by-step assistance
Get Started
Advanced Engineering Mathematics
Authors: A. Ramakrishna Prasad
1st Edition
8126543876, 978-8126543878