

Answered step by step
Verified Expert Solution
Question
1 Approved Answer
5. Hot-air balloons rise because air expands when heated. During the 18th century Jacques Charles, Joseph Louis Gay-Lussac, and others investigated the effect of
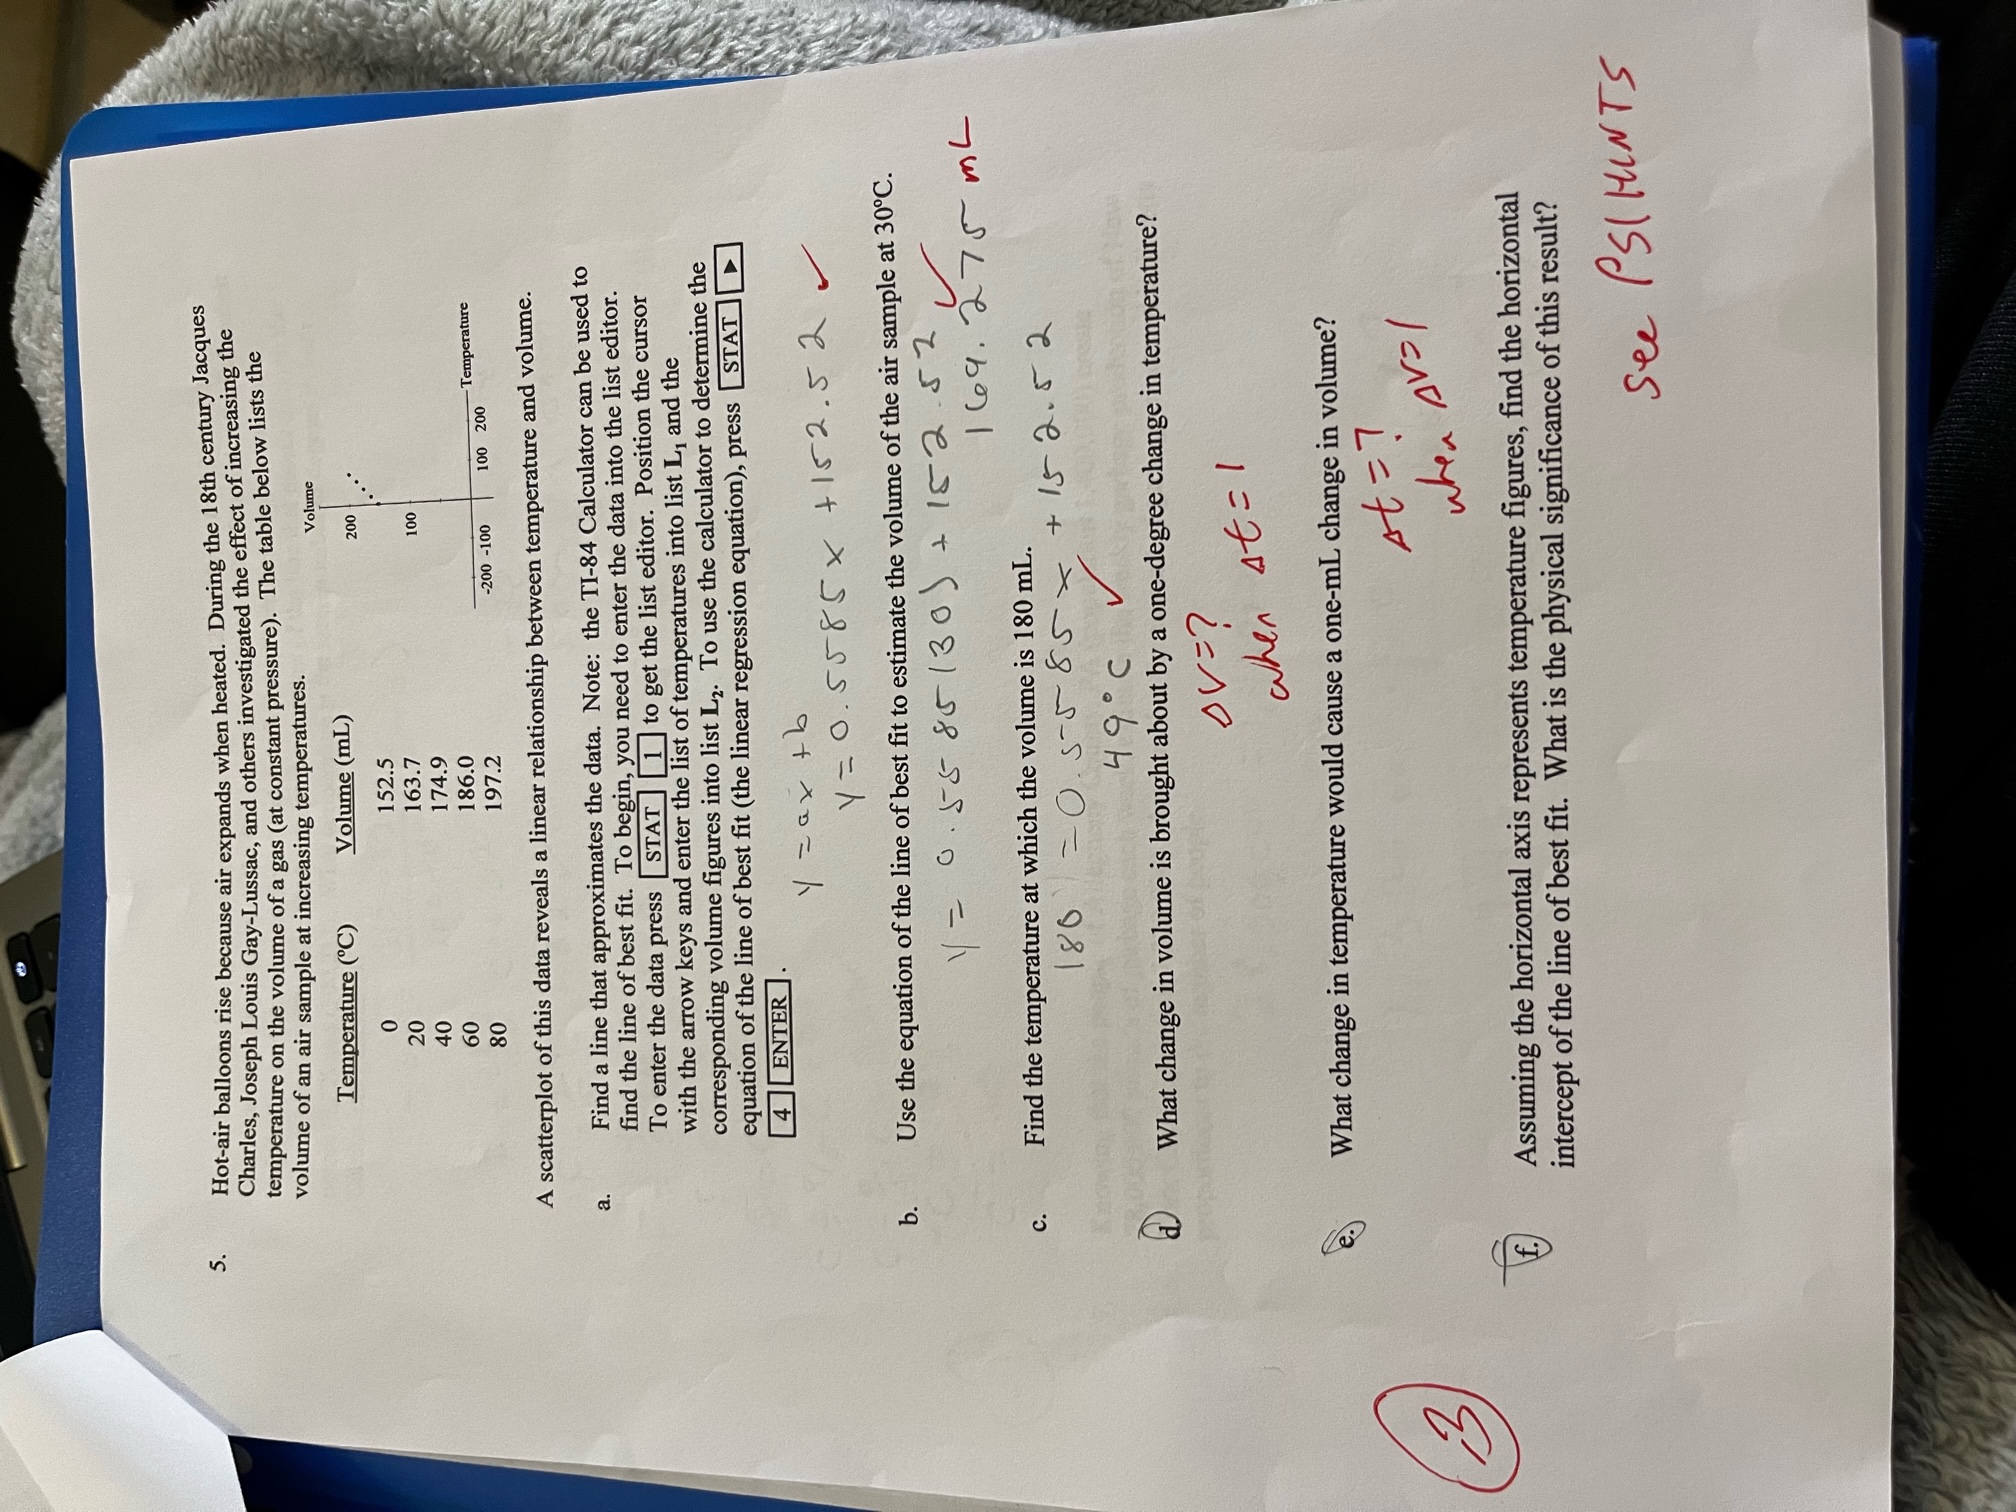
5. Hot-air balloons rise because air expands when heated. During the 18th century Jacques Charles, Joseph Louis Gay-Lussac, and others investigated the effect of increasing the temperature on the volume of a gas (at constant pressure). The table below lists the volume of an air sample at increasing temperatures. Volume 200 b. Temperature (C) 0 20 40 60 80 Volume (mL) 152.5 163.7 174.9 186.0 197.2 100 -200 -100 Temperature 100 200 A scatterplot of this data reveals a linear relationship between temperature and volume. a. Find a line that approximates the data. Note: the TI-84 Calculator can be used to find the line of best fit. To begin, you need to enter the data into the list editor. To enter the data press STAT 1 to get the list editor. Position the cursor with the arrow keys and enter the list of temperatures into list L, and the corresponding volume figures into list L. To use the calculator to determine the equation of the line of best fit (the linear regression equation), press STAT 4 ENTER y = ax + b Y=0.5585x +152.5 Use the equation of the line of best fit to estimate the volume of the air sample at 30C. 0.55 85130) + 152.52 169.275 mL 3 C. Find the temperature at which the volume is 180 mL. 180 =0.55 85 +152.52 490 What change in volume is brought about by a one-degree change in temperature? DV=? when st=1 What change in temperature would cause a one-mL change in volume? st = ? when AV=1 Assuming the horizontal axis represents temperature figures, find the horizontal intercept of the line of best fit. What is the physical significance of this result? See PSIHINTS
Step by Step Solution
There are 3 Steps involved in it
Step: 1
Lets break down the entire problem and answer each part with detailed calculations Given Data Temperature C Volume mL 0 1525 20 1637 40 1749 60 1860 80 1972 Part a Find a line that approximates the da...
Get Instant Access to Expert-Tailored Solutions
See step-by-step solutions with expert insights and AI powered tools for academic success
Step: 2

Step: 3
Ace Your Homework with AI
Get the answers you need in no time with our AI-driven, step-by-step assistance
Get Started
Financial Accounting A User Perspective
Authors: Robert E Hoskin, Maureen R Fizzell, Donald C Cherry
6th Canadian Edition
470676604, 978-0470676608