Answered step by step
Verified Expert Solution
Link Copied!

Question

1 Approved Answer

5. In 2000, the population of Dullville was about 95,000. Over the next decade, the population decreased by 18%. For the questions below, assume this
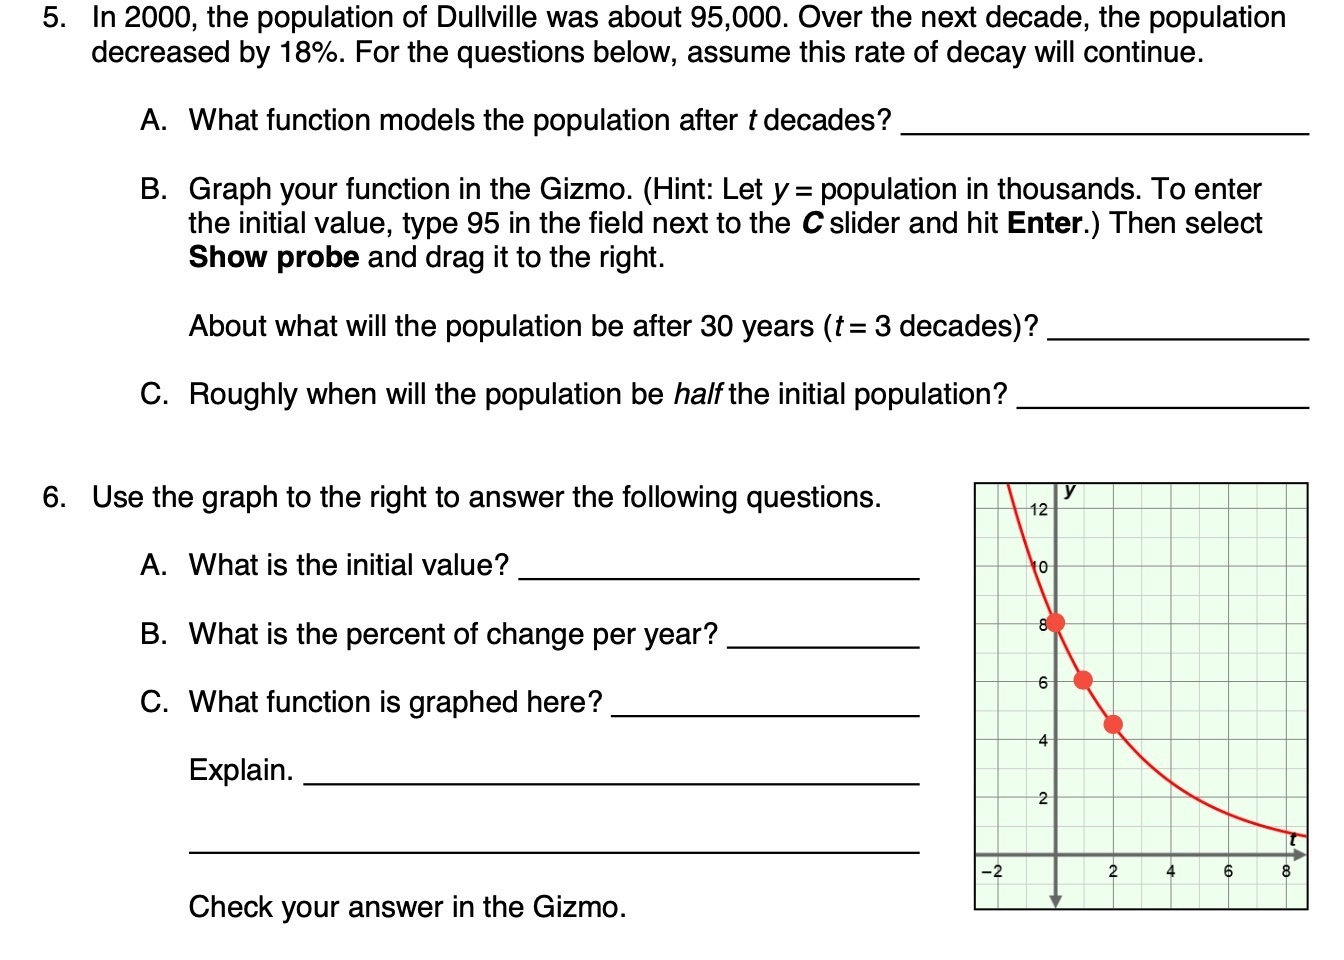
image text in transcribed
5. In 2000, the population of Dullville was about 95,000. Over the next decade, the population decreased by 18%. For the questions below, assume this rate of decay will continue. A. What function models the population after tdecades? B. Graph your function in the Gizmo. (Hint: Let y: population in thousands. To enter the initial value, type 95 in the field next to the Cslider and hit Enter.) Then select Show probe and drag it to the right. About what will the population be after 30 years (t: 3 decades)? C. Roughly when will the population be halfthe initial population? 6. Use the graph to the right to answer the following questions. A. What is the initial value? B. What is the percent of change per year? C. What function is graphed here? Explain. Check your answer in the Gizmo

Step by Step Solution

There are 3 Steps involved in it

Step: 1

blur-text-image

Get Instant Access to Expert-Tailored Solutions

See step-by-step solutions with expert insights and AI powered tools for academic success

Step: 2

blur-text-image

Step: 3

blur-text-image

Ace Your Homework with AI

Get the answers you need in no time with our AI-driven, step-by-step assistance

Get Started

Recommended Textbook for

International Financial Management

Authors: Geert Bekaert, Robert J. Hodrick

2nd edition

013299755X, 132162768, 9780132997553, 978-0132162760

Students also viewed these Mathematics questions

Question

2. Evaluate client satisfaction on our homestay tours.

Answered: 1 week ago