

Question
5 - In addition, you will graph the values as an X Y scatter plot. The graph will use GDP per capita on the Y-axis
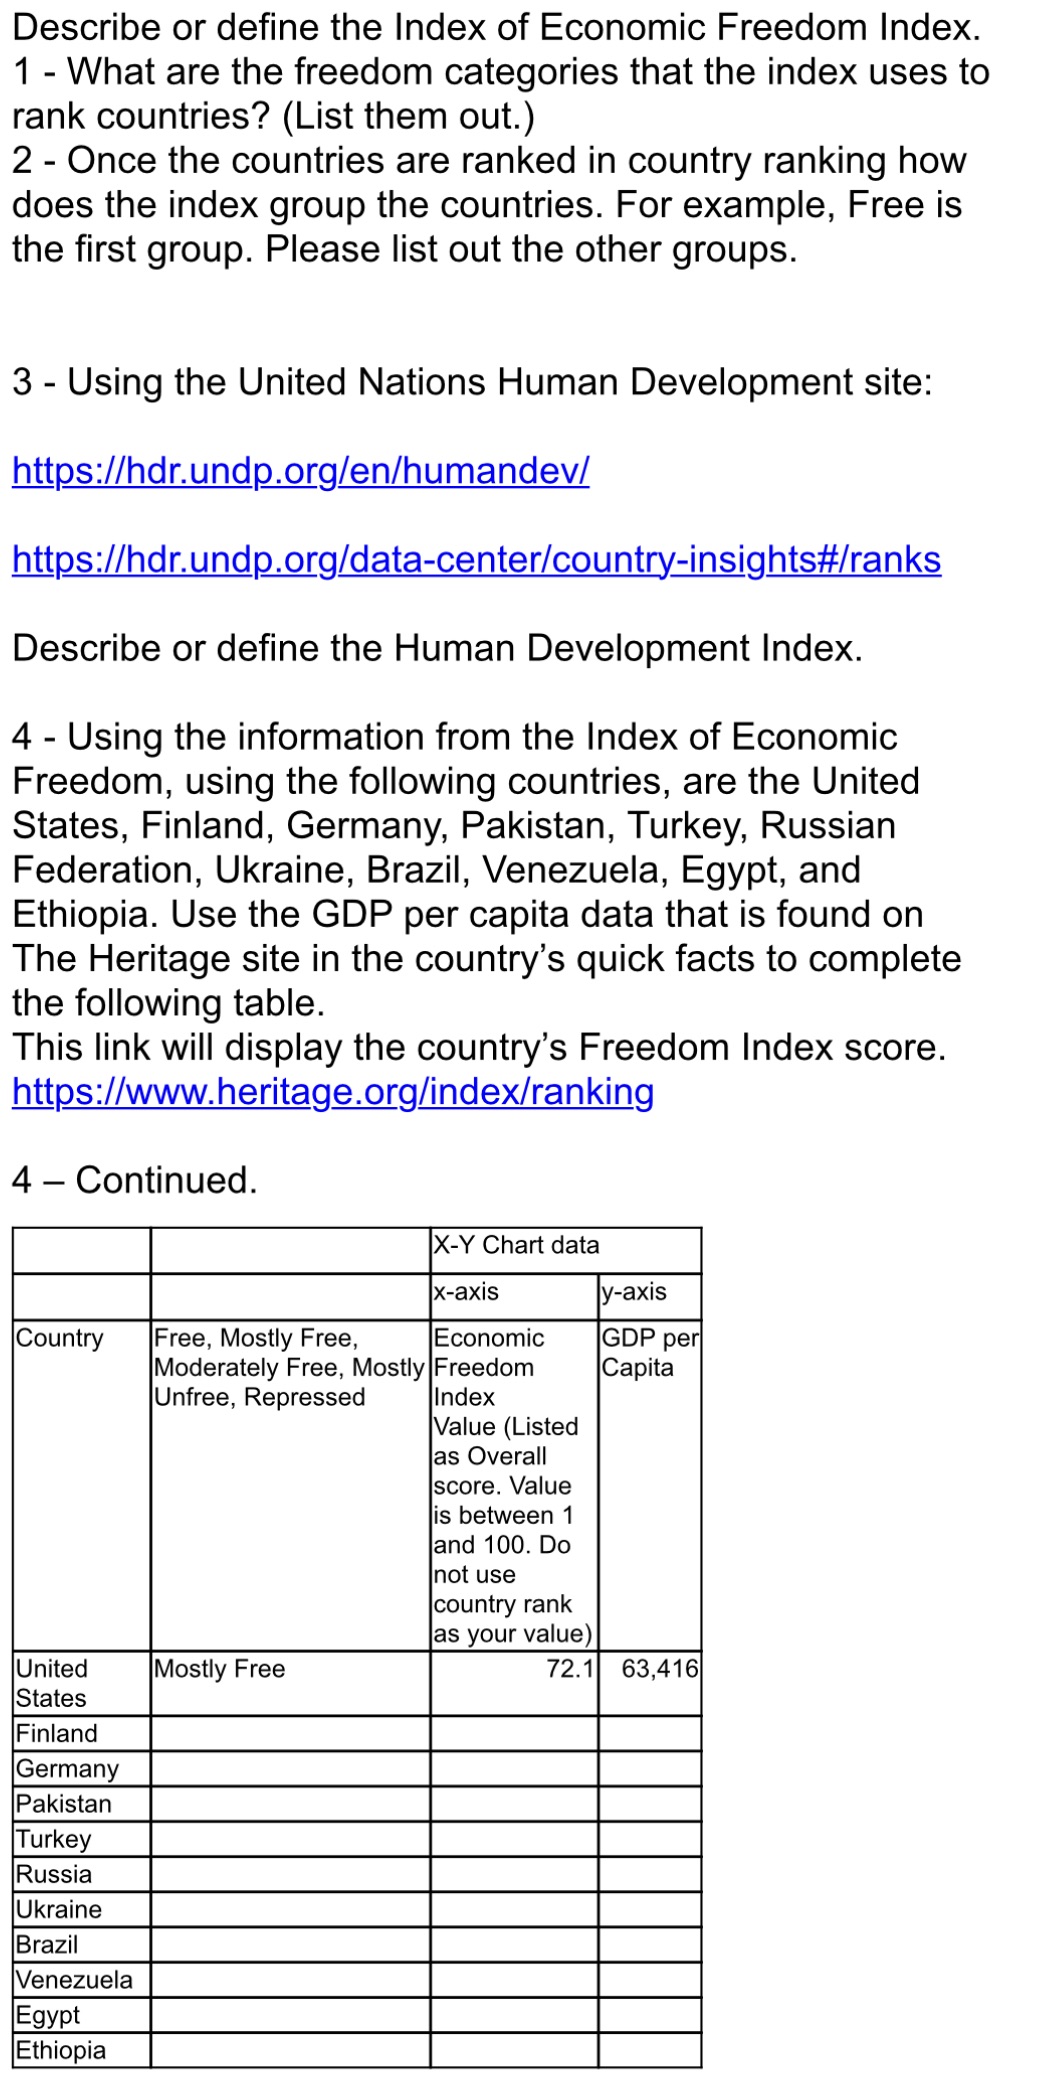
5 - In addition, you will graph the values as an X Y scatter plot. The graph will use GDP per capita on the Y-axis and the Freedom Index composite score on the X-axis. Using Word insert feature, insert a chart, and choose an x - y (scatter chart) option. You will need two variables for each of your observations. Enter your x and y observations. Use the Economic Freedom Index as your x data and use the GDP per capita as your y data. For example, if one of your county's Freedom index data is 67 and GDP per capita is $7,500, enter 67 in the x column and 7,500 in the y column. As an example, your graph will use the following as the axes. ??Freedom Index value Use the Insert Chart Function in Word. Select an x-y scatter plot. 6 - Using the following links to UN HDI data fill in the following table. https://www.hdr.undp.org/en/composite/HDI https://hdr.undp.org/data-center/country-insights#/ranks Country UN HDI Rank UN HDI value GDP per Capita (Use the same data as used in part four.) United States, Finland , Germany , Pakistan , Turkey (Turkiye), Russian, Federation, Ukraine , Brazil , Venezuela , Egypt, Ethiopia
7 - Insert an x y scatter chart of each country's HDI Value and its GDP per capita. Use the HDI value as the x-axis data and the GDP per capita as the y-axis. (Note: Do not use the UN HDI Rank in the scatter plot. Use HDI value and GDP per capita. For example, if the UN HDI value is 0.931 and the GDP per capita is 43,953, enter 0.931 for the x value and 43,953 for y's value) Insert your chart here.
Please answer the following:
8 - Briefly define GDP
9 - Briefly define GDP per capita
10 - When comparing economic growth between countries why do we need to use GDP per capita?
11- Briefly describe how the data is related to each of your graphs.
9 - What does your data tell you about the Freedom Index of a country and its possible GDP per capita?
10 - What does your data tell you about the UN Development Index and its possible GDP per capita?
11 - What does this mean about the level of freedom a country has and its welfare and its relative wealth?
12 - Can you see any patterns in the data you collected? In other words, do you think there is a relationship between GDP-per-capita, economic freedom, and human development? Why or why not? How might each of those factors impact individual well-being? Create a Works Cited for
Step by Step Solution
There are 3 Steps involved in it
Step: 1

Get Instant Access to Expert-Tailored Solutions
See step-by-step solutions with expert insights and AI powered tools for academic success
Step: 2

Step: 3
Ace Your Homework with AI
Get the answers you need in no time with our AI-driven, step-by-step assistance
Get Started
Environmental Markets A Property Rights Approach
Authors: Terry L Anderson, Gary D Libecap
1st Edition
0521279658, 9780521279659