

Answered step by step
Verified Expert Solution
Question
1 Approved Answer
5. Label the original equilibrium price point with a black dot a. Draw a new supply curve increase b. Draw a straight line through
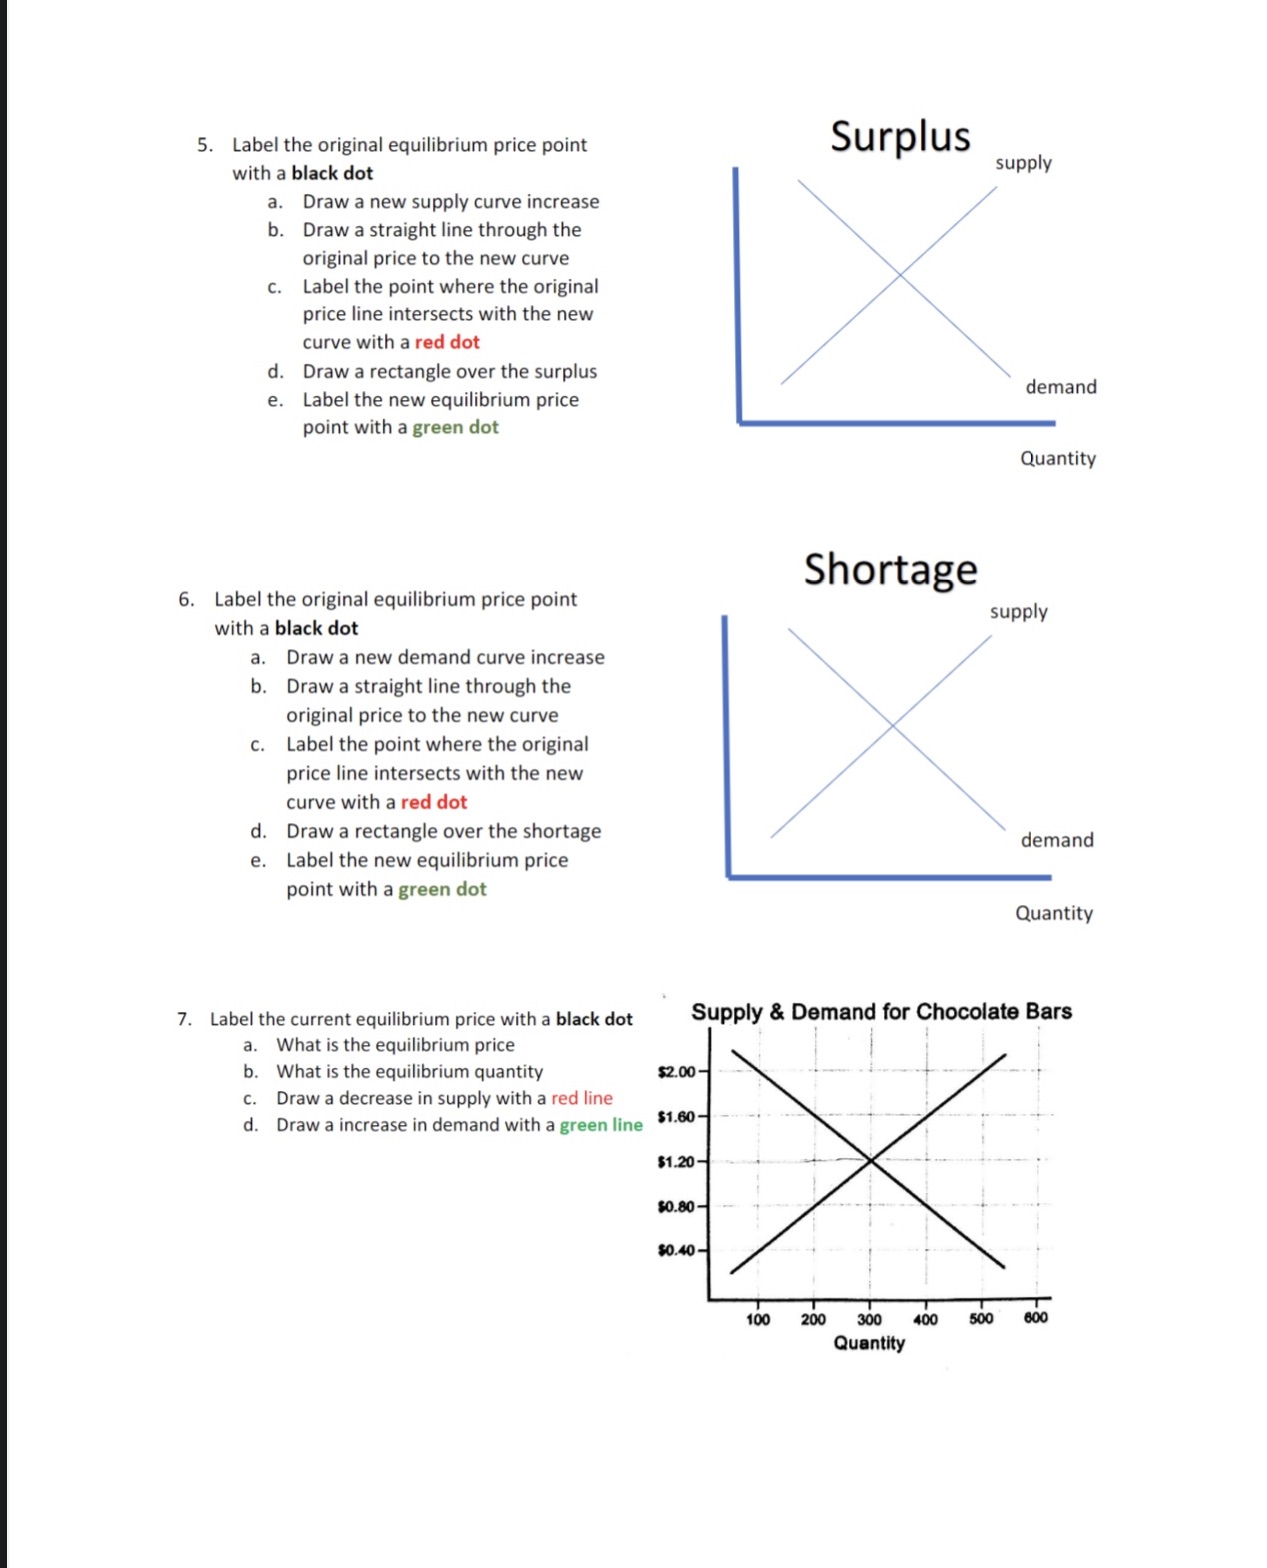
5. Label the original equilibrium price point with a black dot a. Draw a new supply curve increase b. Draw a straight line through the original price to the new curve c. Label the point where the original price line intersects with the new curve with a red dot d. Draw a rectangle over the surplus e. Label the new equilibrium price point with a green dot Surplus supply demand Quantity 6. Label the original equilibrium price point with a black dot a. Draw a new demand curve increase b. Draw a straight line through the original price to the new curve c. Label the point where the original price line intersects with the new curve with a red dot d. Draw a rectangle over the shortage e. Label the new equilibrium price point with a green dot Shortage supply demand Quantity Supply & Demand for Chocolate Bars 7. Label the current equilibrium price with a black dot a. What is the equilibrium price b. What is the equilibrium quantity $2.00- c. Draw a decrease in supply with a red line d. Draw a increase in demand with a green line $1.60- $1.20- $0.80- $0.40- 100 200 300 400 500 600 Quantity
Step by Step Solution
There are 3 Steps involved in it
Step: 1

Get Instant Access to Expert-Tailored Solutions
See step-by-step solutions with expert insights and AI powered tools for academic success
Step: 2

Step: 3
Ace Your Homework with AI
Get the answers you need in no time with our AI-driven, step-by-step assistance
Get Started
Core Macroeconomics
Authors: Eric Chiang
3rd edition
978-1429278478, 1429278471, 978-1429278492, 1429278498, 1464191433, 978-1464191435