

Answered step by step
Verified Expert Solution
Question
1 Approved Answer
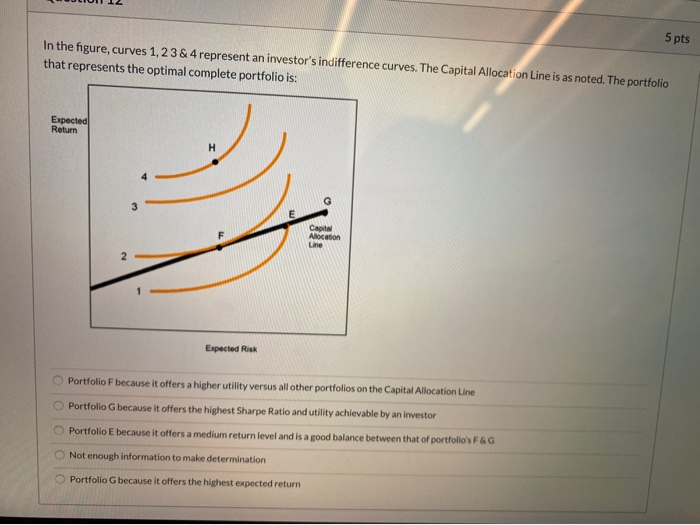
5 pts In the figure, curves 1, 2 3 & 4 represent an investor's indifference curves. The Capital Allocation Line is as noted. The portfolio
Step by Step Solution
There are 3 Steps involved in it
Step: 1

Get Instant Access to Expert-Tailored Solutions
See step-by-step solutions with expert insights and AI powered tools for academic success
Step: 2

Step: 3
Ace Your Homework with AI
Get the answers you need in no time with our AI-driven, step-by-step assistance
Get Started
Inflation Growth And International Finance
Authors: Alec Cairncross
1st Edition
113865308X, 978-1138653085