

Answered step by step
Verified Expert Solution
Question
1 Approved Answer
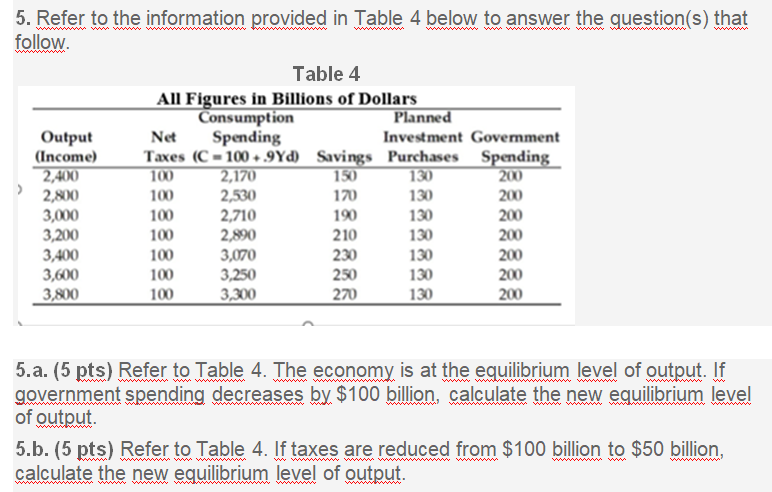
5. Refer to the information provided in Table 4 below to answer the question(s) that follow Table 4 All Figures in Billions of Dollars Consumption
Step by Step Solution
There are 3 Steps involved in it
Step: 1

Get Instant Access to Expert-Tailored Solutions
See step-by-step solutions with expert insights and AI powered tools for academic success
Step: 2

Step: 3
Ace Your Homework with AI
Get the answers you need in no time with our AI-driven, step-by-step assistance
Get Started
Technical Change, Relative Prices, And Environmental Resource Evaluation
Authors: V Kerry Smith
1st Edition
1317358570, 9781317358572