

Answered step by step
Verified Expert Solution
Question
1 Approved Answer
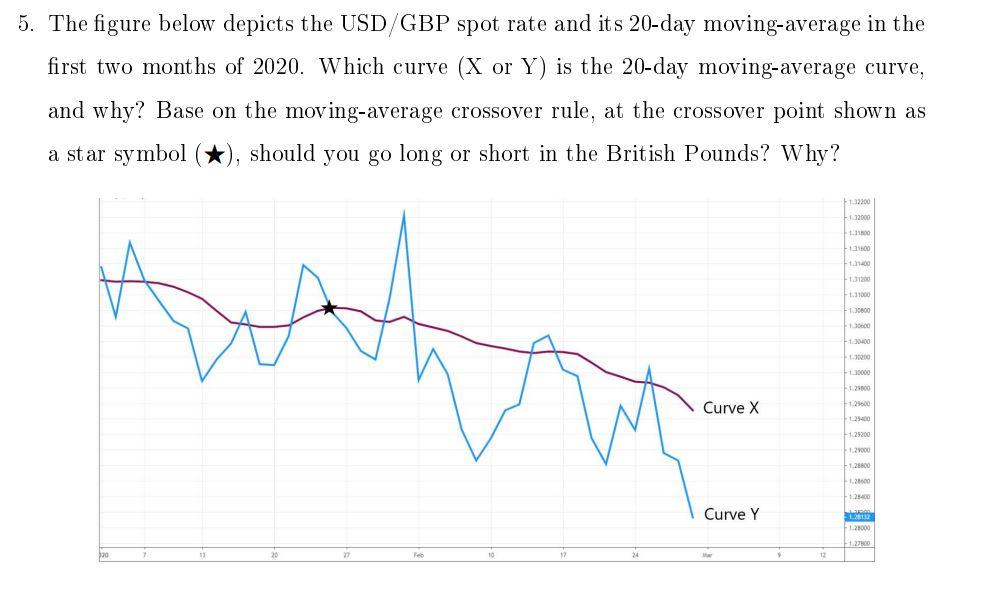
5. The figure below depicts the USD/GBP spot rate and its 20-day moving average in the first two months of 2020. Which curve (X or
Step by Step Solution
There are 3 Steps involved in it
Step: 1

Get Instant Access to Expert-Tailored Solutions
See step-by-step solutions with expert insights and AI powered tools for academic success
Step: 2

Step: 3
Ace Your Homework with AI
Get the answers you need in no time with our AI-driven, step-by-step assistance
Get Started
Finance for Executives Managing for Value Creation
Authors: Gabriel Hawawini, Claude Viallet
4th edition
9781133169949, 538751347, 978-0538751346