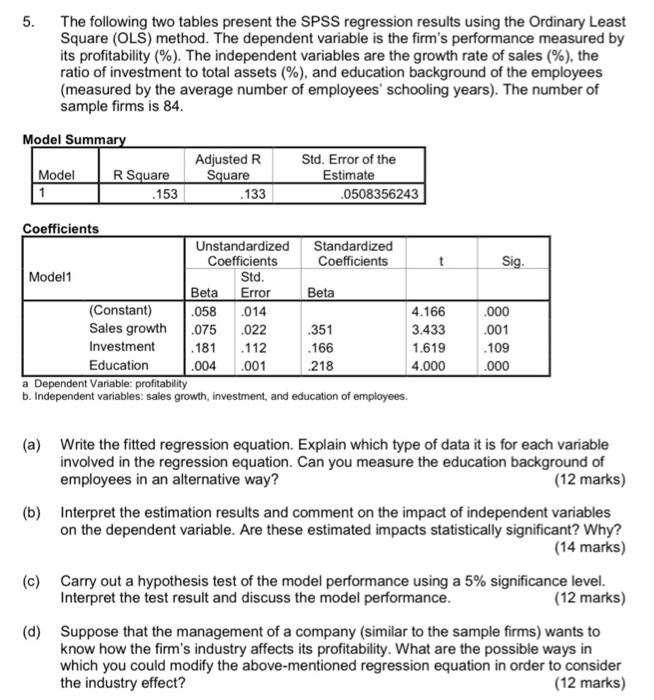
5. The following two tables present the SPSS regression results using the Ordinary Least Square (OLS) method. The dependent variable is the firm's performance measured by its profitability (%). The independent variables are the growth rate of sales (%), the ratio of investment to total assets (%), and education background of the employees (measured by the average number of employees' schooling years). The number of sample firms is 84. Model Summary Adjusted R Square Std. Error of the Estimate Model R Square 1 .133 Coefficients Unstandardized Coefficients t Sig. Model1 Std. Beta Error (Constant) .058 .014 4.166 .000 Sales growth .075 .022 3.433 .001 Investment .181 112 1.619 .109 Education .004 .001 218 4.000 .000 a Dependent Variable: profitability b. Independent variables: sales growth, investment, and education of employees. (a) Write the fitted regression equation. Explain which type of data it is for each variable involved in the regression equation. Can you measure the education background of employees in an alternative way? (12 marks) (b) Interpret the estimation results and comment on the impact of independent variables on the dependent variable. Are these estimated impacts statistically significant? Why? (14 marks) (c) Carry out a hypothesis test of the model performance using a 5% significance level. Interpret the test result and discuss the model performance. (12 marks) (d) Suppose that the management of a company (similar to the sample firms) wants to know how the firm's industry affects its profitability. What are the possible ways in which you could modify the above-mentioned regression equation in order to consider the industry effect? (12 marks) .153 .0508356243 Standardized Coefficients Beta .351 .166