

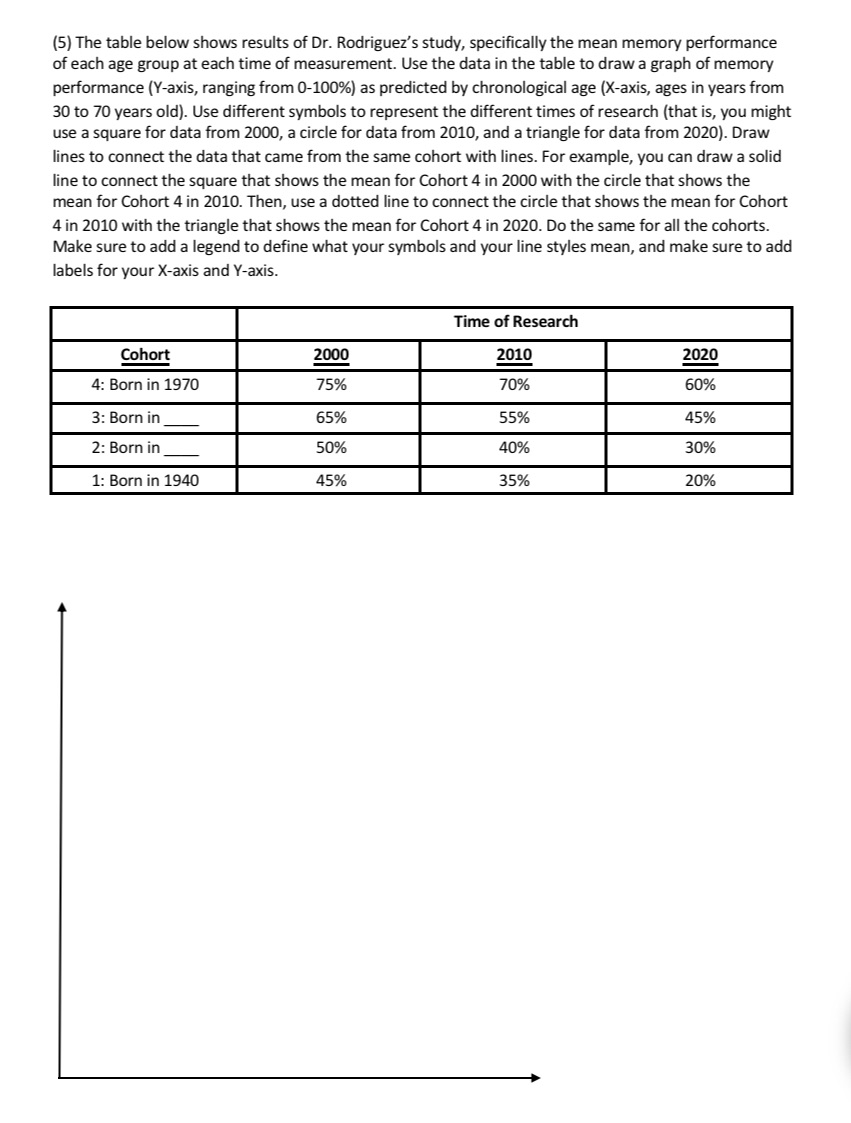
(5) The table below shows results of Dr. Rodriguez's study, specifically the mean memory performance of...
Fantastic news! We've Found the answer you've been seeking!
Question:
Expert Answer:

Related Book For 

Mathematical Interest Theory
ISBN: 9781470465681
3rd Edition
Authors: Leslie Jane, James Daniel, Federer Vaaler
Posted Date:
