

Answered step by step
Verified Expert Solution
Question
1 Approved Answer
5. The table below shows the percentage of females in the U.S. labor force at various times throughout history. Years after 1900 100 50
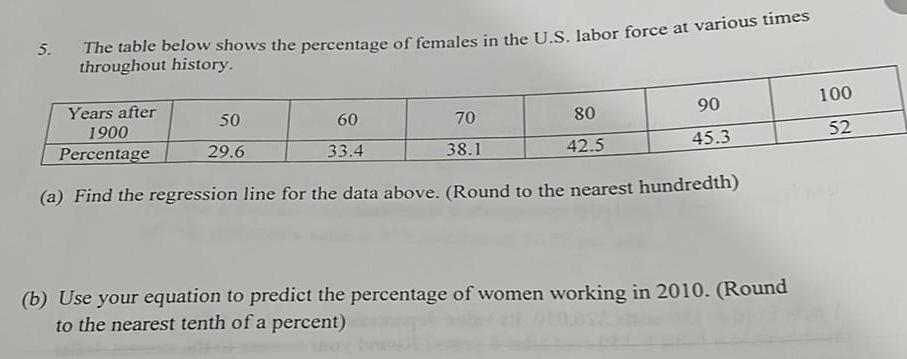
5. The table below shows the percentage of females in the U.S. labor force at various times throughout history. Years after 1900 100 50 60 70 80 90 Percentage 29.6 33.4 38.1 42.5 45.3 52 (a) Find the regression line for the data above. (Round to the nearest hundredth) (b) Use your equation to predict the percentage of women working in 2010. (Round to the nearest tenth of a percent)
Step by Step Solution
There are 3 Steps involved in it
Step: 1

Get Instant Access to Expert-Tailored Solutions
See step-by-step solutions with expert insights and AI powered tools for academic success
Step: 2

Step: 3
Ace Your Homework with AI
Get the answers you need in no time with our AI-driven, step-by-step assistance
Get Started
Forecasting Time Series And Regression
Authors: Bruce L. Bowerman, Richard O'Connell, Anne Koehler
4th Edition
0534409776, 9780534409777