

Answered step by step
Verified Expert Solution
Question
1 Approved Answer
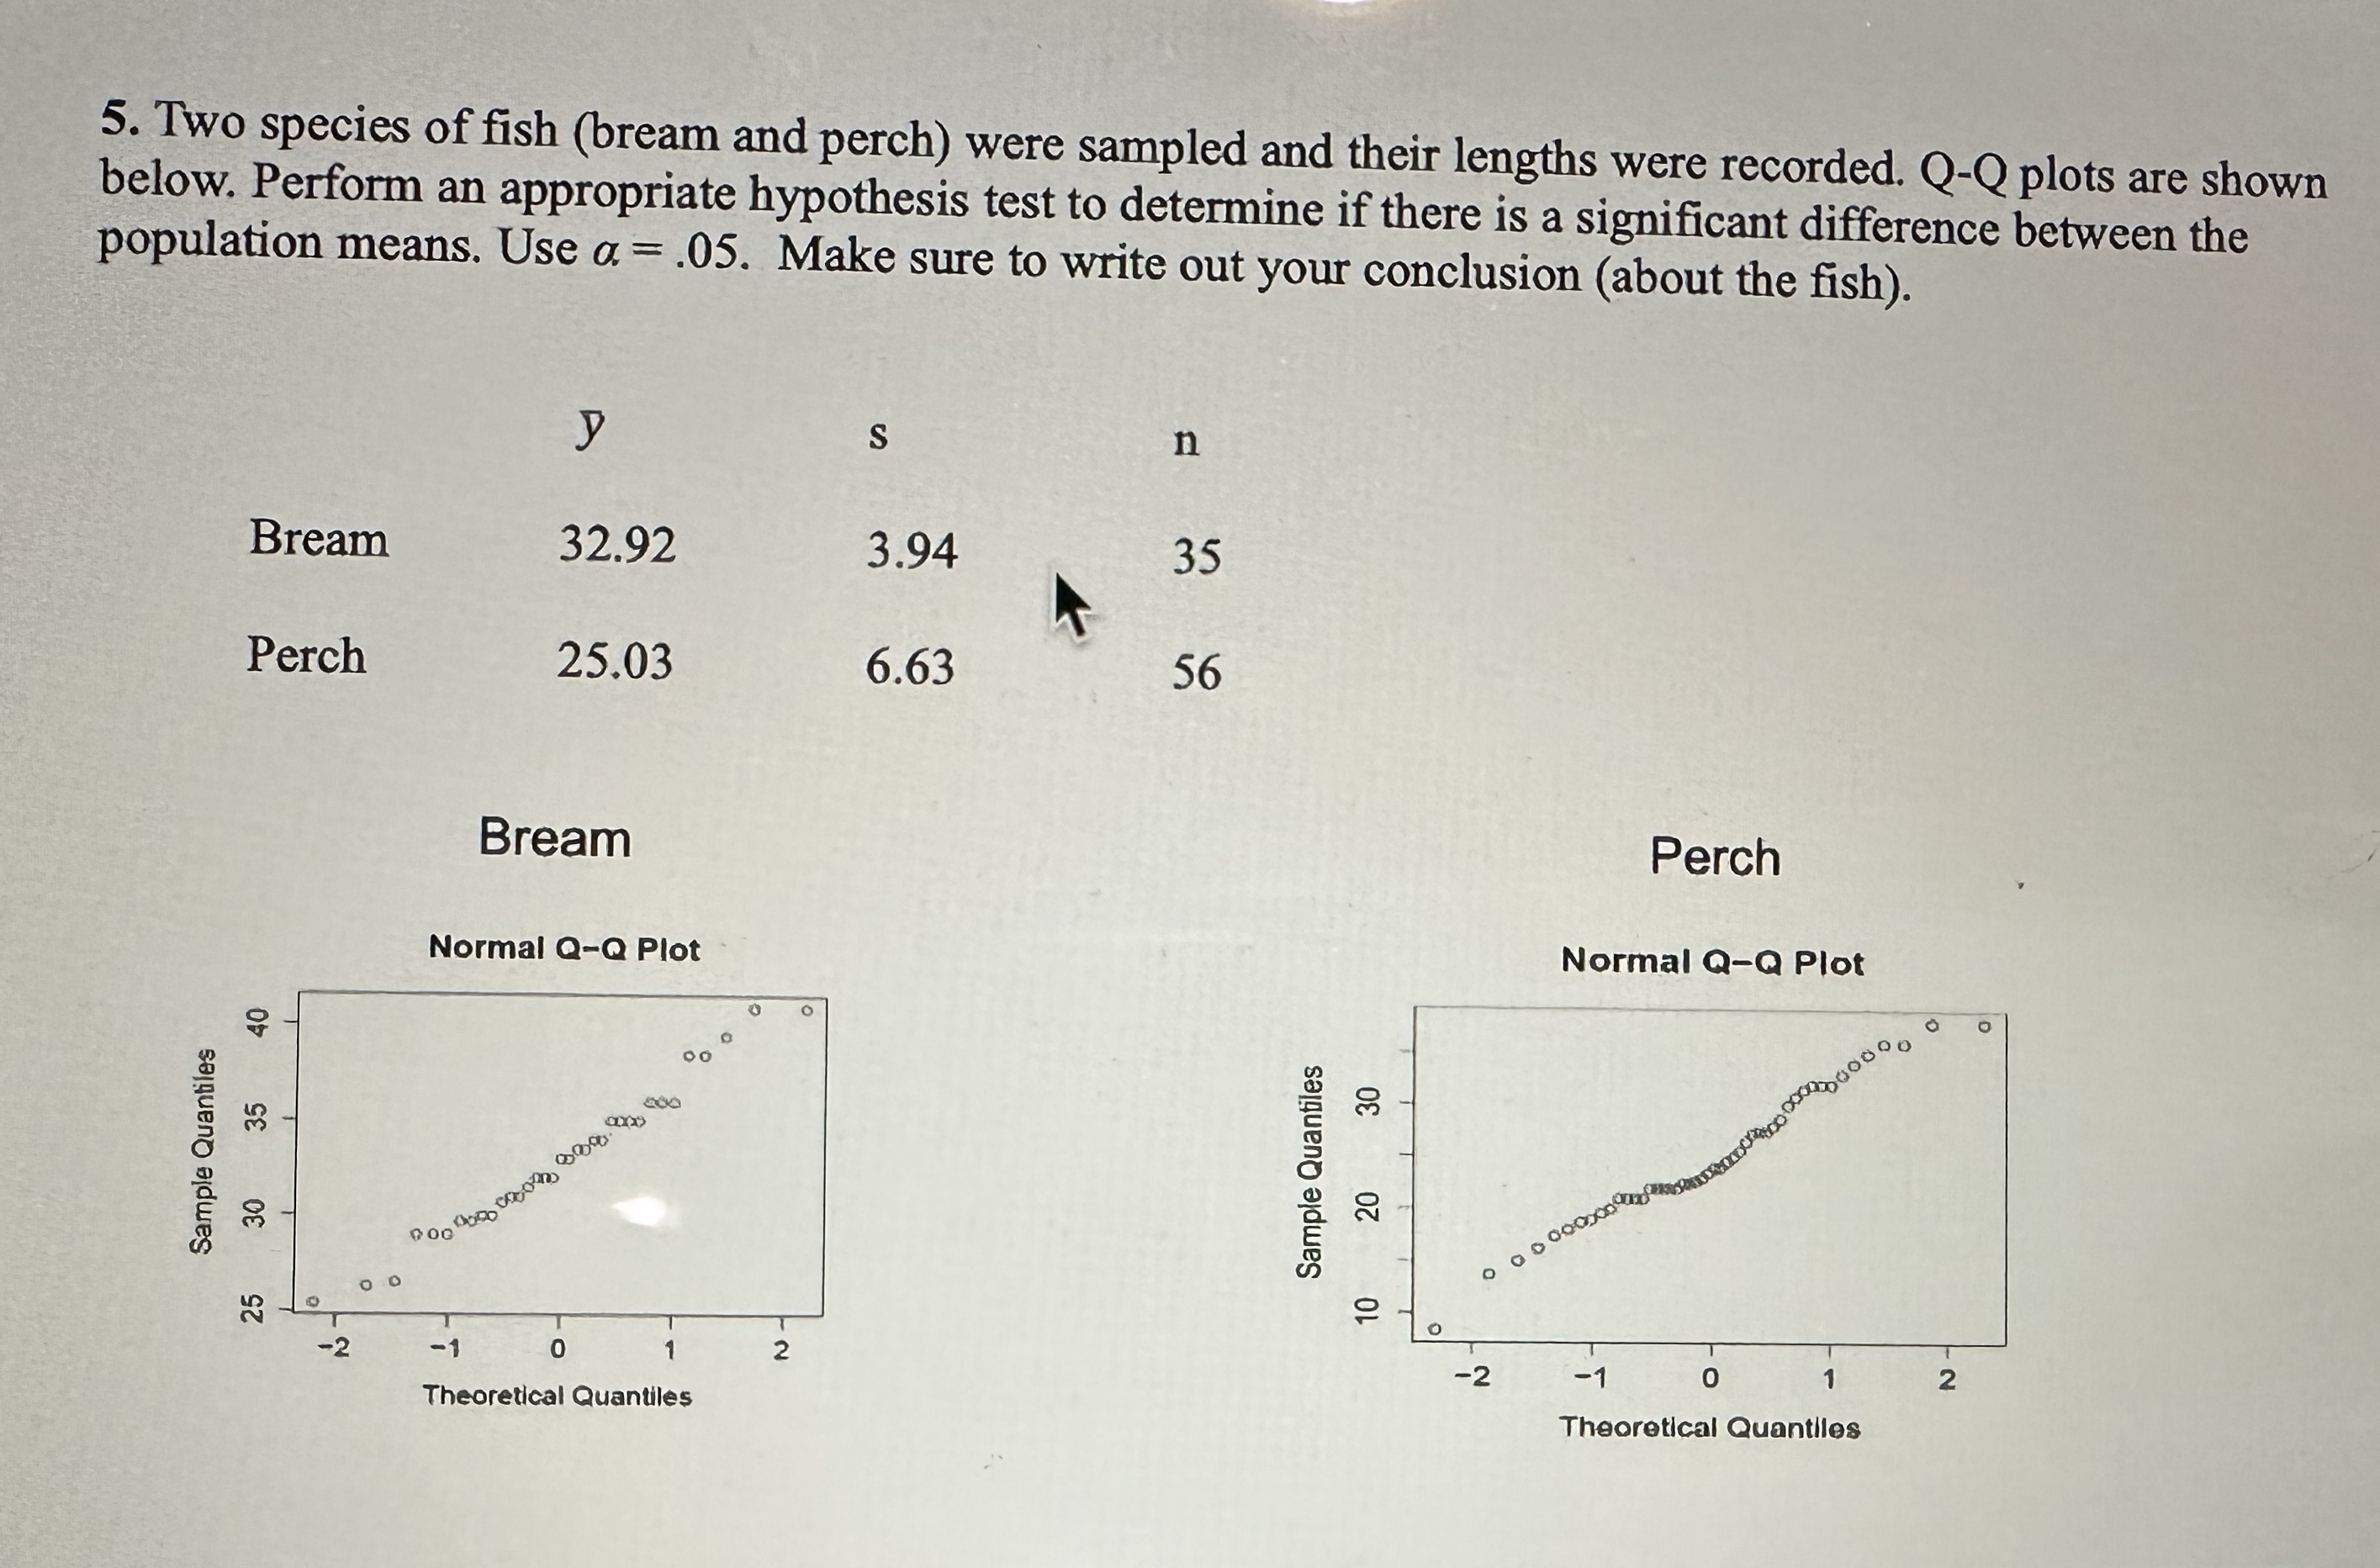
5. Two species of fish (bream and perch) were sampled and their lengths were recorded. Q-Q plots are shown below. Perform an appropriate hypothesis test
Step by Step Solution
There are 3 Steps involved in it
Step: 1

Get Instant Access to Expert-Tailored Solutions
See step-by-step solutions with expert insights and AI powered tools for academic success
Step: 2

Step: 3
Ace Your Homework with AI
Get the answers you need in no time with our AI-driven, step-by-step assistance
Get Started
Linear Algebra With Applications
Authors: W. Keith Nicholson
7th Edition
978-0070985100, 70985103