Answered step by step
Verified Expert Solution
Question
1 Approved Answer
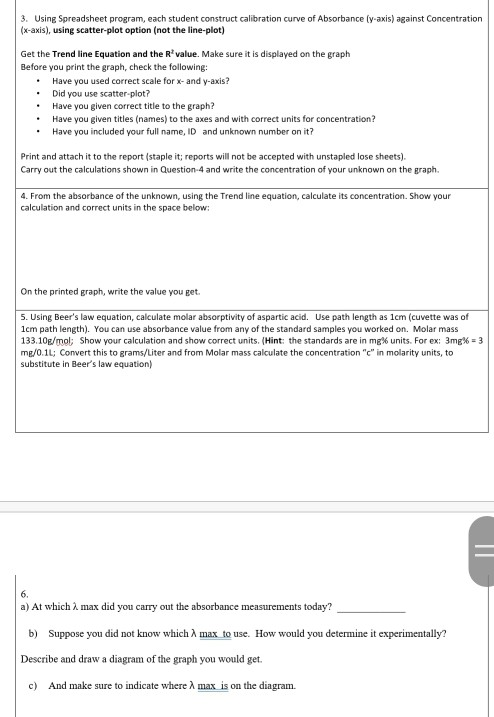
3. Using Spreadsheet program, each student construct calibration curve of Absorbance (y-axis) against Concentration (x-axis), using scatter-plot option (not the line-plot) Get the Trend

3. Using Spreadsheet program, each student construct calibration curve of Absorbance (y-axis) against Concentration (x-axis), using scatter-plot option (not the line-plot) Get the Trend line Equation and the R value. Make sure it is displayed on the graph Before you print the graph, check the following: Have you used correct scale for x- and y-axis? Did you use scatter-plot? Have you given correct title to the graph? Have you given titles (names) to the axes and with correct units for concentration? Have you included your full name, ID and unknown number on it? Print and attach it to the report (staple it; reports will not be accepted with unstapled lose sheets). Carry out the calculations shown in Question-4 and write the concentration of your unknown on the graph. 4. From the absorbance of the unknown, using the Trend line equation, calculate its concentration. Show your calculation and correct units in the space below: On the printed graph, write the value you get. 5. Using Beer's law equation, calculate molar absorptivity of aspartic acid. Use path length as 1cm (cuvette was of 1cm path length). You can use absorbance value from any of the standard samples you worked on. Molar mass 133.10g/mol; Show your calculation and show correct units. (Hint: the standards are in mg % units. For ex: 3mg% = 3 mg/0.1L; Convert this to grams/Liter and from Molar mass calculate the concentration "c" in molarity units, to substitute in Beer's law equation) 6. a) At which max did you carry out the absorbance measurements today? b) Suppose you did not know which max to use. How would you determine it experimentally? Describe and draw a diagram of the graph you would get. c) And make sure to indicate where max is on the diagram.
Step by Step Solution
★★★★★
3.44 Rating (151 Votes )
There are 3 Steps involved in it
Step: 1

Get Instant Access to Expert-Tailored Solutions
See step-by-step solutions with expert insights and AI powered tools for academic success
Step: 2

Step: 3

Ace Your Homework with AI
Get the answers you need in no time with our AI-driven, step-by-step assistance
Get Started


