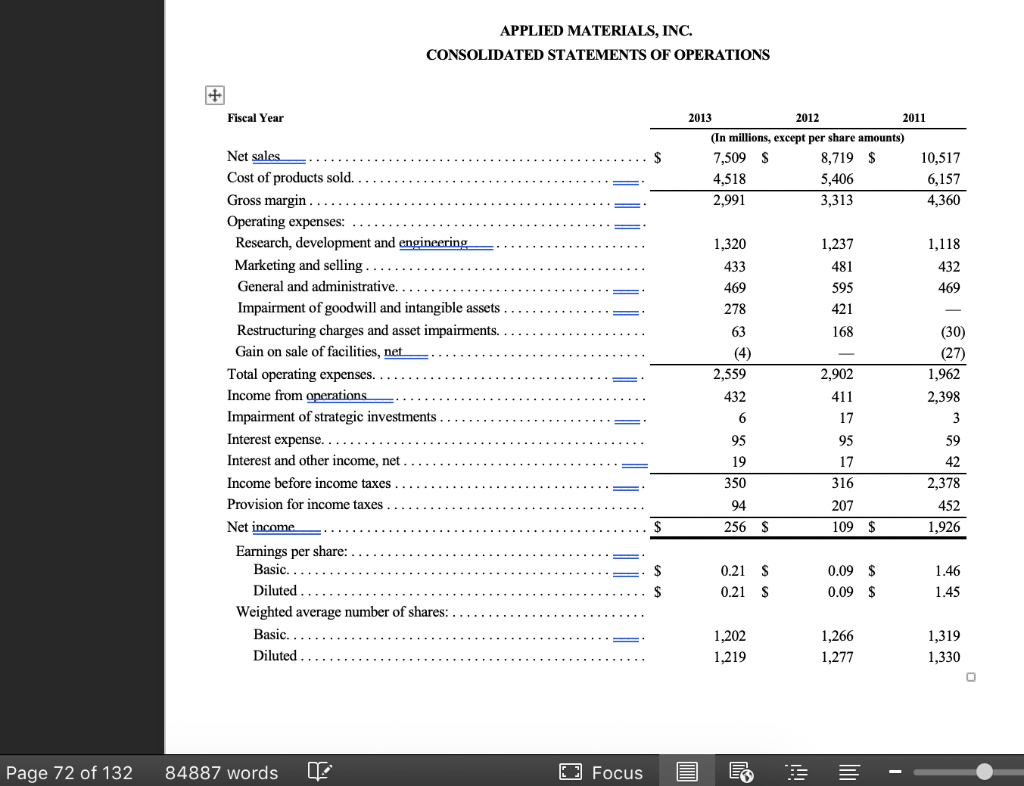
5. What is included in Other Income (expenses)? Explain these accounts.
6. What was Interest Expense? What was it as a percentage to net sales?
7. What was the companys effective tax rate (Taxes/Earnings B4 Taxes)? Was it this rate stable or volatile?
8. What happened to the companys net profit margin? Are there any plans for improvement of net income?
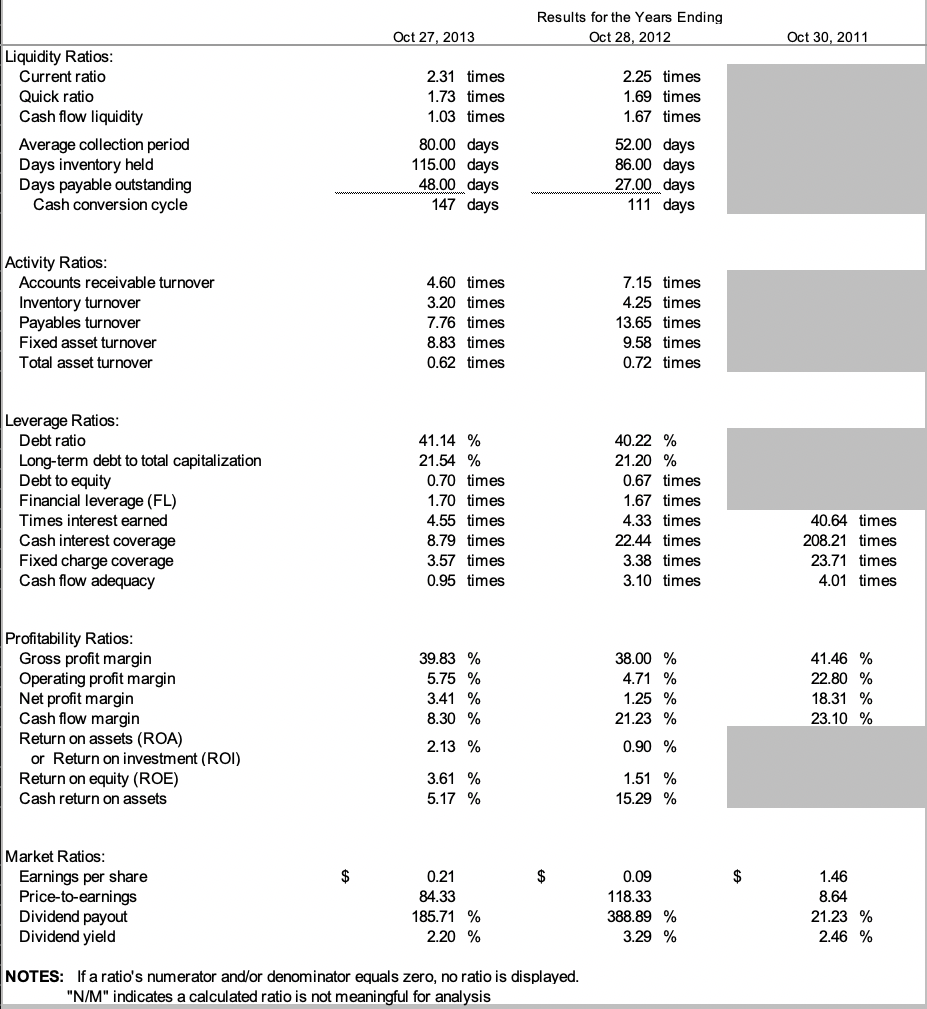
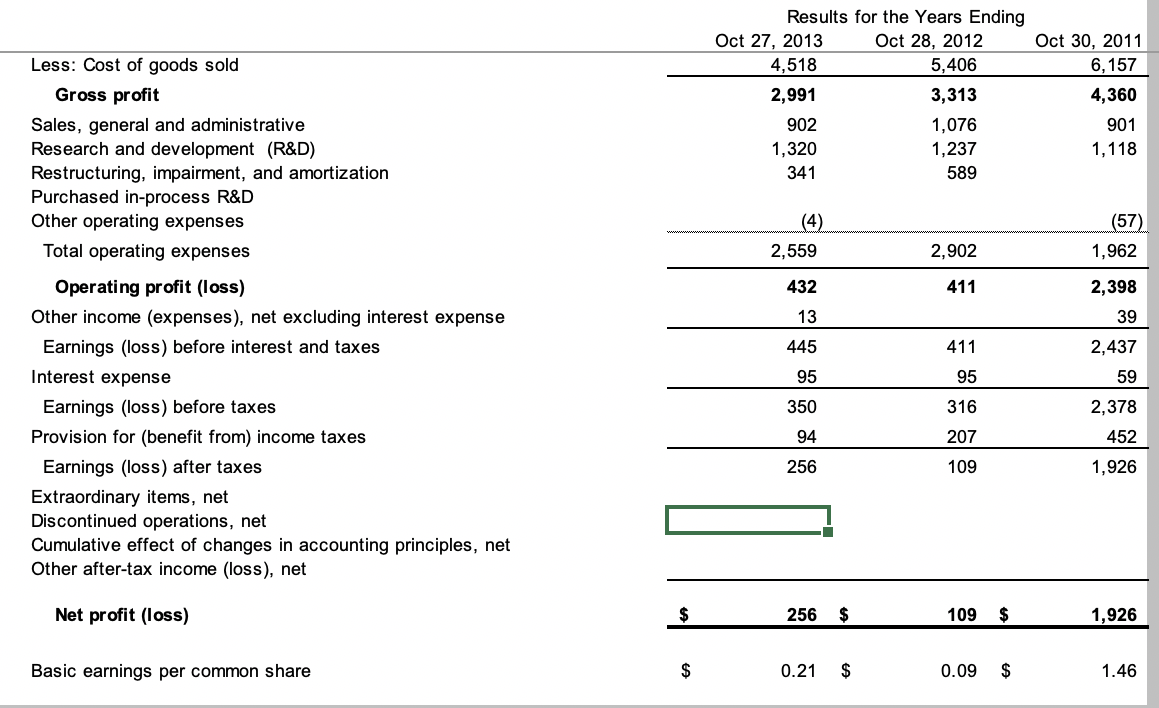
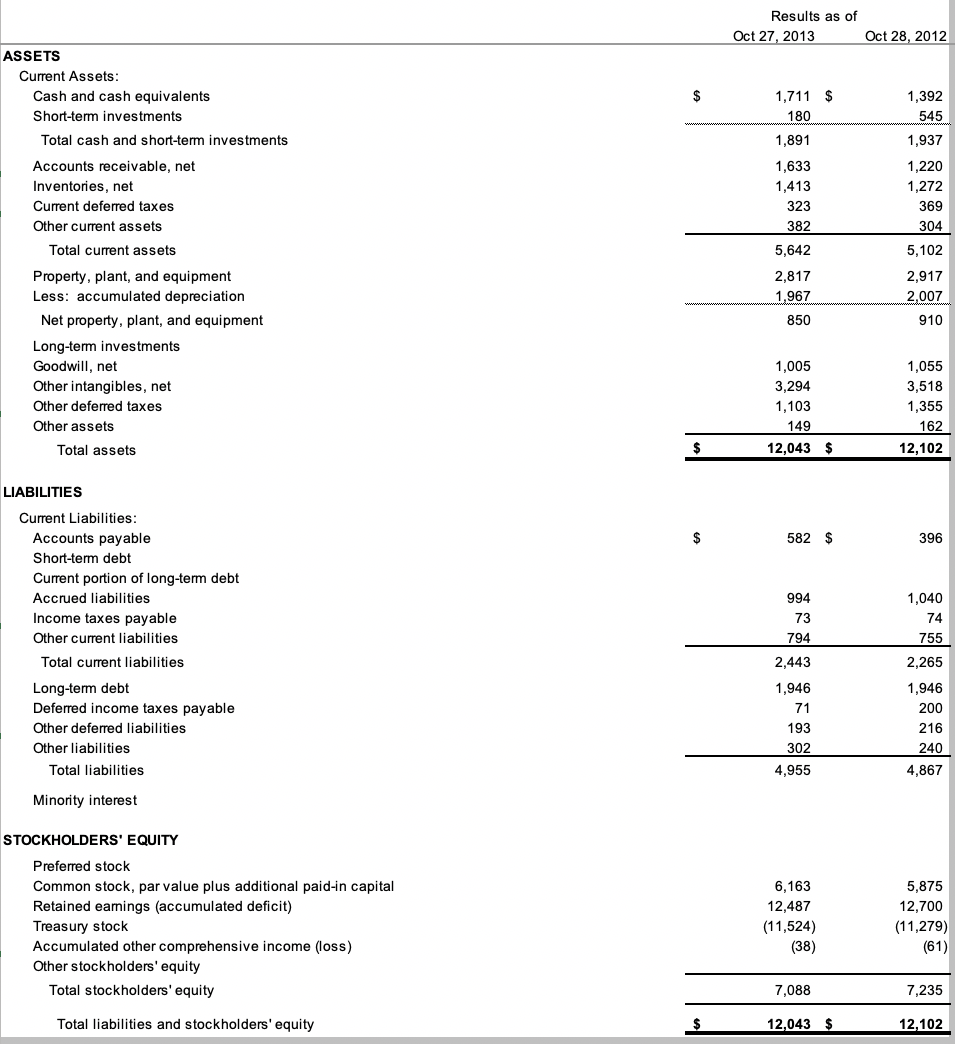
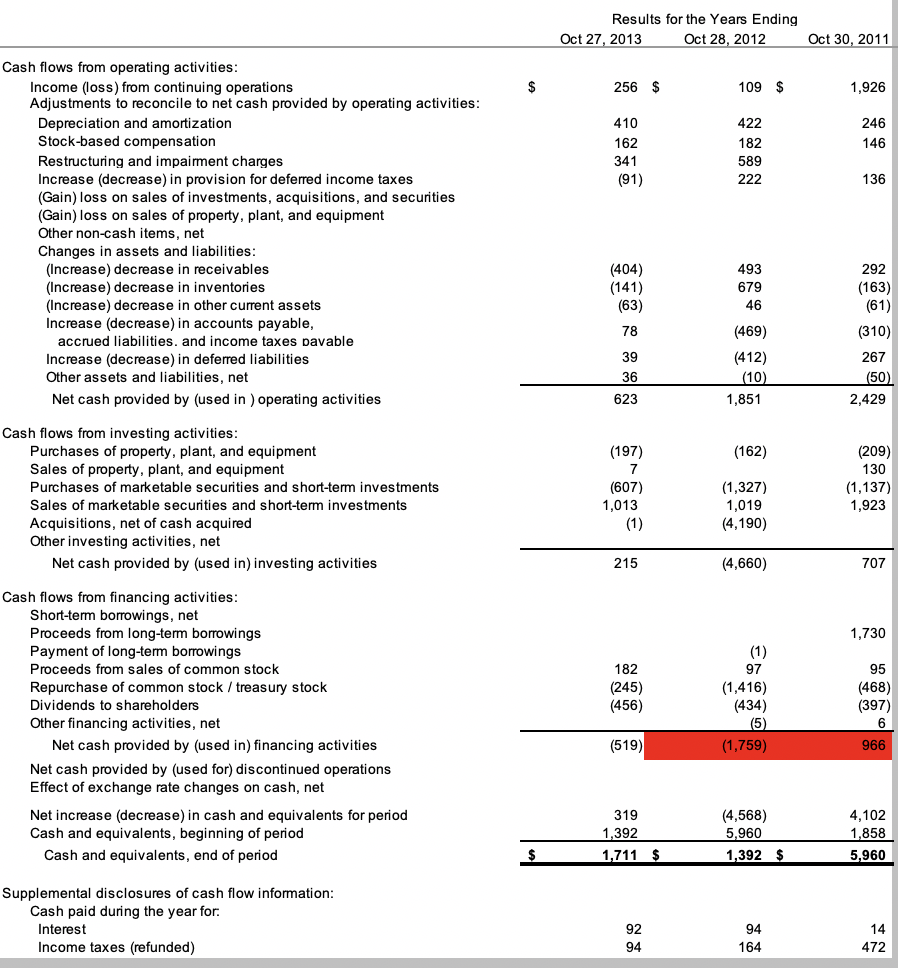
Results for the Years Ending Oct 28, 2012 Oct 27, 2013 Oct 30, 2011 Liquidity Ratios: Current ratio Quick ratio Cash flow liquidity Average collection period Days inventory held Days payable outstanding Cash conversion cycle 2.31 times 1.73 times 1.03 times 80.00 days 115.00 days 48.00 days 147 days 2.25 times 1.69 times 1.67 times 52.00 days 86.00 days 27.00 days 111 days Activity Ratios: Accounts receivable turnover Inventory turnover Payables turnover Fixed asset turnover Total asset turnover 4.60 times 3.20 times 7.76 times 8.83 times 0.62 times 7.15 times 4.25 times 13.65 times 9.58 times 0.72 times Leverage Ratios: Debt ratio Long-term debt to total capitalization Debt to equity Financial leverage (FL) Times interest earned Cash interest coverage Fixed charge coverage Cash flow adequacy 41.14 % 21.54 % 0.70 times 1.70 times 4.55 times 8.79 times 3.57 times 0.95 times 40.22 % 21.20 % 0.67 times 1.67 times 4.33 times 22.44 times 3.38 times 3.10 times 40.64 times 208.21 times 23.71 times 4.01 times Profitability Ratios: Gross profit margin Operating profit margin Net profit margin Cash flow margin Return on assets (ROA) or Return on investment (ROI) Return on equity (ROE) Cash return on assets 39.83 % 5.75 % 3.41 % 8.30 % 2.13 % 3.61% 5.17 % 38.00 % 4.71 % 1.25 % 21.23 % 0.90 % 41.46 % 22.80 % 18.31 % 23.10 % 1.51 % 15.29 % $ Market Ratios: Earnings per share Price-to-earnings Dividend payout Dividend yield 0.21 84.33 185.71 % 2.20 % 0.09 118.33 388.89 % 3.29 % 1.46 8.64 21.23 % 2.46 % NOTES: If a ratio's numerator and/or denominator equals zero, no ratio is displayed. "N/M" indicates a calculated ratio is not meaningful for analysis Results for the Years Ending Oct 27, 2013 Oct 28, 2012 Oct 30, 2011 4.518 5,406 6,157 2,991 3,313 4,360 902 1,076 1,320 1,237 1,118 341 589 901 (4) 2,559 (57) 1,962 2,902 432 411 Less: Cost of goods sold Gross profit Sales, general and administrative Research and development (R&D) Restructuring, impairment, and amortization Purchased in-process R&D Other operating expenses Total operating expenses Operating profit (loss) Other income (expenses), net excluding interest expense Earnings (loss) before interest and taxes Interest expense Earnings (loss) before taxes Provision for benefit from) income taxes Earnings (loss) after taxes Extraordinary items, net Discontinued operations, net Cumulative effect of changes in accounting principles, net Other after-tax income (loss), net 13 445 95 411 95 316 2,398 39 2,437 59 2,378 452 1,926 350 94 256 207 109 Net profit (loss) 256 $ 109 $ 1,926 Basic earnings per common share 0.21 $ 0.09 $ .46 Results as of Oct 27, 2013 Oct 28, 2012 1,711 $ 180 1,392 545 1,937 1,891 1,220 1,633 1,413 323 382 ASSETS Current Assets: Cash and cash equivalents Short-term investments Total cash and short-term investments Accounts receivable, net Inventories, net Current deferred taxes Other current assets Total current assets Property, plant, and equipment Less: accumulated depreciation Net property, plant, and equipment Long-term investments Goodwill, net Other intangibles, net Other deferred taxes Other assets Total assets 5,642 1,272 369 304 5,102 2,917 2,007 910 2,817 1,967 850 1,005 3,294 1,103 149 12,043 $ 1,055 3,518 1,355 162 12,102 582 $ 396 994 1,040 73 74 LIABILITIES Current Liabilities: Accounts payable Short-term debt Current portion of long-term debt Accrued liabilities Income taxes payable Other current liabilities Total current liabilities Long-term debt Deferred income taxes payable Other deferred liabilities Other liabilities Total liabilities 794 2,443 1,946 71 193 302 4,955 755 2,265 1,946 200 216 240 4,867 Minority interest STOCKHOLDERS' EQUITY Preferred stock Common stock, par value plus additional paid-in capital Retained earings (accumulated deficit) Treasury stock Accumulated other comprehensive income (loss) Other stockholders' equity Total stockholders' equity 6,163 12,487 (11,524) (38) 5,875 12,700 (11,279) (61) 7,088 7,235 Total liabilities and stockholders' equity 12,043 $ 12,102 Results for the Years Ending Oct 27, 2013 Oct 28, 2012 Oct 30, 2011 256 $ 109 $ 1,926 410 162 341 (91) 422 182 589 222 246 146 Cash flows from operating activities: Income (loss) from continuing operations Adjustments to reconcile to net cash provided by operating activities: Depreciation and amortization Stock-based compensation Restructuring and impairment charges Increase (decrease) in provision for deferred income taxes (Gain) loss on sales of investments, acquisitions, and securities (Gain) loss on sales of property, plant, and equipment Other non-cash items, net Changes in assets and liabilities: (Increase) decrease in receivables (Increase) decrease in inventories (Increase) decrease in other current assets Increase (decrease) in accounts payable, accrued liabilities, and income taxes pavable Increase (decrease) in deferred liabilities Other assets and liabilities, net Net cash provided by (used in ) operating activities (404) (141) (63) 493 679 46 (469) (412) (10) 1,851 292 (163) (61) (310) 267 (50) 2,429 623 (197) (162) Cash flows from investing activities: Purchases of property, plant, and equipment Sales of property, plant, and equipment Purchases of marketable securities and short-term investments Sales of marketable securities and short-term investments Acquisitions, net of cash acquired Other investing activities, net Net cash provided by (used in) investing activities (209) 130 (1,137) 1,923 (607) 1,013 (1) (1,327) 1,019 (4,190) 215 (4,660) 707 1,730 182 (245) (456) (1) 97 (1,416) (434) (468) (397) Cash flows from financing activities: Short-term borrowings, net Proceeds from long-term borrowings Payment of long-term borrowings Proceeds from sales of common stock Repurchase of common stock /treasury stock Dividends to shareholders Other financing activities, net Net cash provided by (used in) financing activities Net cash provided by (used for) discontinued operations Effect of exchange rate changes on cash, net Net increase (decrease) in cash and equivalents for period Cash and equivalents, beginning of period Cash and equivalents, end of period (5) (519) (1,759) 966 s 319 1,392 1,711 $ (4,568) 5,960 1,392 4,102 1,858 5,960 $ Supplemental disclosures of cash flow information: Cash paid during the year for. Interest Income taxes (refunded) 14 164 472 APPLIED MATERIALS, INC. CONSOLIDATED STATEMENTS OF OPERATIONS Fiscal Year 2013 2012 2011 (In millions, except per share amounts) 7,509 $ 8,719 $ 10,517 4,518 6,157 3,313 4,360 5,406 2,991 1,320 1,118 1,237 481 433 432 168 (4 (27) 2,559 2,902 1,962 432 2,398 Net sales Cost of products sold. .......... Gross margin.... Operating expenses: ........ Research, development and engineering Marketing and selling .... General and administrative......... Impairment of goodwill and intangible assets.. Restructuring charges and asset impairments Gain on sale of facilities, net ...... Total operating expenses......... Income from operations Impairment of strategic investments ....... Interest expense... Interest and other income, net Income before income taxes... Provision for income taxes ..... Net income Earnings per share: ..... Basic........................ Diluted ............. Weighted average number of shares: . Basic..... Diluted .. a 17 e 59 42 19 350 17 316 207 109 $ 2,378 452 1,926 256 S 1.46 0.21 $ 0.21 S 0.09 0.09 $ $ 1.45 1,266 1,202 1,219 1,319 1,330 1,277 Page 72 of 132 84887 words E Focus E E E - Results for the Years Ending Oct 28, 2012 Oct 27, 2013 Oct 30, 2011 Liquidity Ratios: Current ratio Quick ratio Cash flow liquidity Average collection period Days inventory held Days payable outstanding Cash conversion cycle 2.31 times 1.73 times 1.03 times 80.00 days 115.00 days 48.00 days 147 days 2.25 times 1.69 times 1.67 times 52.00 days 86.00 days 27.00 days 111 days Activity Ratios: Accounts receivable turnover Inventory turnover Payables turnover Fixed asset turnover Total asset turnover 4.60 times 3.20 times 7.76 times 8.83 times 0.62 times 7.15 times 4.25 times 13.65 times 9.58 times 0.72 times Leverage Ratios: Debt ratio Long-term debt to total capitalization Debt to equity Financial leverage (FL) Times interest earned Cash interest coverage Fixed charge coverage Cash flow adequacy 41.14 % 21.54 % 0.70 times 1.70 times 4.55 times 8.79 times 3.57 times 0.95 times 40.22 % 21.20 % 0.67 times 1.67 times 4.33 times 22.44 times 3.38 times 3.10 times 40.64 times 208.21 times 23.71 times 4.01 times Profitability Ratios: Gross profit margin Operating profit margin Net profit margin Cash flow margin Return on assets (ROA) or Return on investment (ROI) Return on equity (ROE) Cash return on assets 39.83 % 5.75 % 3.41 % 8.30 % 2.13 % 3.61% 5.17 % 38.00 % 4.71 % 1.25 % 21.23 % 0.90 % 41.46 % 22.80 % 18.31 % 23.10 % 1.51 % 15.29 % $ Market Ratios: Earnings per share Price-to-earnings Dividend payout Dividend yield 0.21 84.33 185.71 % 2.20 % 0.09 118.33 388.89 % 3.29 % 1.46 8.64 21.23 % 2.46 % NOTES: If a ratio's numerator and/or denominator equals zero, no ratio is displayed. "N/M" indicates a calculated ratio is not meaningful for analysis Results for the Years Ending Oct 27, 2013 Oct 28, 2012 Oct 30, 2011 4.518 5,406 6,157 2,991 3,313 4,360 902 1,076 1,320 1,237 1,118 341 589 901 (4) 2,559 (57) 1,962 2,902 432 411 Less: Cost of goods sold Gross profit Sales, general and administrative Research and development (R&D) Restructuring, impairment, and amortization Purchased in-process R&D Other operating expenses Total operating expenses Operating profit (loss) Other income (expenses), net excluding interest expense Earnings (loss) before interest and taxes Interest expense Earnings (loss) before taxes Provision for benefit from) income taxes Earnings (loss) after taxes Extraordinary items, net Discontinued operations, net Cumulative effect of changes in accounting principles, net Other after-tax income (loss), net 13 445 95 411 95 316 2,398 39 2,437 59 2,378 452 1,926 350 94 256 207 109 Net profit (loss) 256 $ 109 $ 1,926 Basic earnings per common share 0.21 $ 0.09 $ .46 Results as of Oct 27, 2013 Oct 28, 2012 1,711 $ 180 1,392 545 1,937 1,891 1,220 1,633 1,413 323 382 ASSETS Current Assets: Cash and cash equivalents Short-term investments Total cash and short-term investments Accounts receivable, net Inventories, net Current deferred taxes Other current assets Total current assets Property, plant, and equipment Less: accumulated depreciation Net property, plant, and equipment Long-term investments Goodwill, net Other intangibles, net Other deferred taxes Other assets Total assets 5,642 1,272 369 304 5,102 2,917 2,007 910 2,817 1,967 850 1,005 3,294 1,103 149 12,043 $ 1,055 3,518 1,355 162 12,102 582 $ 396 994 1,040 73 74 LIABILITIES Current Liabilities: Accounts payable Short-term debt Current portion of long-term debt Accrued liabilities Income taxes payable Other current liabilities Total current liabilities Long-term debt Deferred income taxes payable Other deferred liabilities Other liabilities Total liabilities 794 2,443 1,946 71 193 302 4,955 755 2,265 1,946 200 216 240 4,867 Minority interest STOCKHOLDERS' EQUITY Preferred stock Common stock, par value plus additional paid-in capital Retained earings (accumulated deficit) Treasury stock Accumulated other comprehensive income (loss) Other stockholders' equity Total stockholders' equity 6,163 12,487 (11,524) (38) 5,875 12,700 (11,279) (61) 7,088 7,235 Total liabilities and stockholders' equity 12,043 $ 12,102 Results for the Years Ending Oct 27, 2013 Oct 28, 2012 Oct 30, 2011 256 $ 109 $ 1,926 410 162 341 (91) 422 182 589 222 246 146 Cash flows from operating activities: Income (loss) from continuing operations Adjustments to reconcile to net cash provided by operating activities: Depreciation and amortization Stock-based compensation Restructuring and impairment charges Increase (decrease) in provision for deferred income taxes (Gain) loss on sales of investments, acquisitions, and securities (Gain) loss on sales of property, plant, and equipment Other non-cash items, net Changes in assets and liabilities: (Increase) decrease in receivables (Increase) decrease in inventories (Increase) decrease in other current assets Increase (decrease) in accounts payable, accrued liabilities, and income taxes pavable Increase (decrease) in deferred liabilities Other assets and liabilities, net Net cash provided by (used in ) operating activities (404) (141) (63) 493 679 46 (469) (412) (10) 1,851 292 (163) (61) (310) 267 (50) 2,429 623 (197) (162) Cash flows from investing activities: Purchases of property, plant, and equipment Sales of property, plant, and equipment Purchases of marketable securities and short-term investments Sales of marketable securities and short-term investments Acquisitions, net of cash acquired Other investing activities, net Net cash provided by (used in) investing activities (209) 130 (1,137) 1,923 (607) 1,013 (1) (1,327) 1,019 (4,190) 215 (4,660) 707 1,730 182 (245) (456) (1) 97 (1,416) (434) (468) (397) Cash flows from financing activities: Short-term borrowings, net Proceeds from long-term borrowings Payment of long-term borrowings Proceeds from sales of common stock Repurchase of common stock /treasury stock Dividends to shareholders Other financing activities, net Net cash provided by (used in) financing activities Net cash provided by (used for) discontinued operations Effect of exchange rate changes on cash, net Net increase (decrease) in cash and equivalents for period Cash and equivalents, beginning of period Cash and equivalents, end of period (5) (519) (1,759) 966 s 319 1,392 1,711 $ (4,568) 5,960 1,392 4,102 1,858 5,960 $ Supplemental disclosures of cash flow information: Cash paid during the year for. Interest Income taxes (refunded) 14 164 472 APPLIED MATERIALS, INC. CONSOLIDATED STATEMENTS OF OPERATIONS Fiscal Year 2013 2012 2011 (In millions, except per share amounts) 7,509 $ 8,719 $ 10,517 4,518 6,157 3,313 4,360 5,406 2,991 1,320 1,118 1,237 481 433 432 168 (4 (27) 2,559 2,902 1,962 432 2,398 Net sales Cost of products sold. .......... Gross margin.... Operating expenses: ........ Research, development and engineering Marketing and selling .... General and administrative......... Impairment of goodwill and intangible assets.. Restructuring charges and asset impairments Gain on sale of facilities, net ...... Total operating expenses......... Income from operations Impairment of strategic investments ....... Interest expense... Interest and other income, net Income before income taxes... Provision for income taxes ..... Net income Earnings per share: ..... Basic........................ Diluted ............. Weighted average number of shares: . Basic..... Diluted .. a 17 e 59 42 19 350 17 316 207 109 $ 2,378 452 1,926 256 S 1.46 0.21 $ 0.21 S 0.09 0.09 $ $ 1.45 1,266 1,202 1,219 1,319 1,330 1,277 Page 72 of 132 84887 words E Focus E E E


