Answered step by step
Verified Expert Solution
Link Copied!

Question

1 Approved Answer

5. You are evaluating the performance of two portfolio managers and you have gathered annual return data for the past decade Year Manager X Return
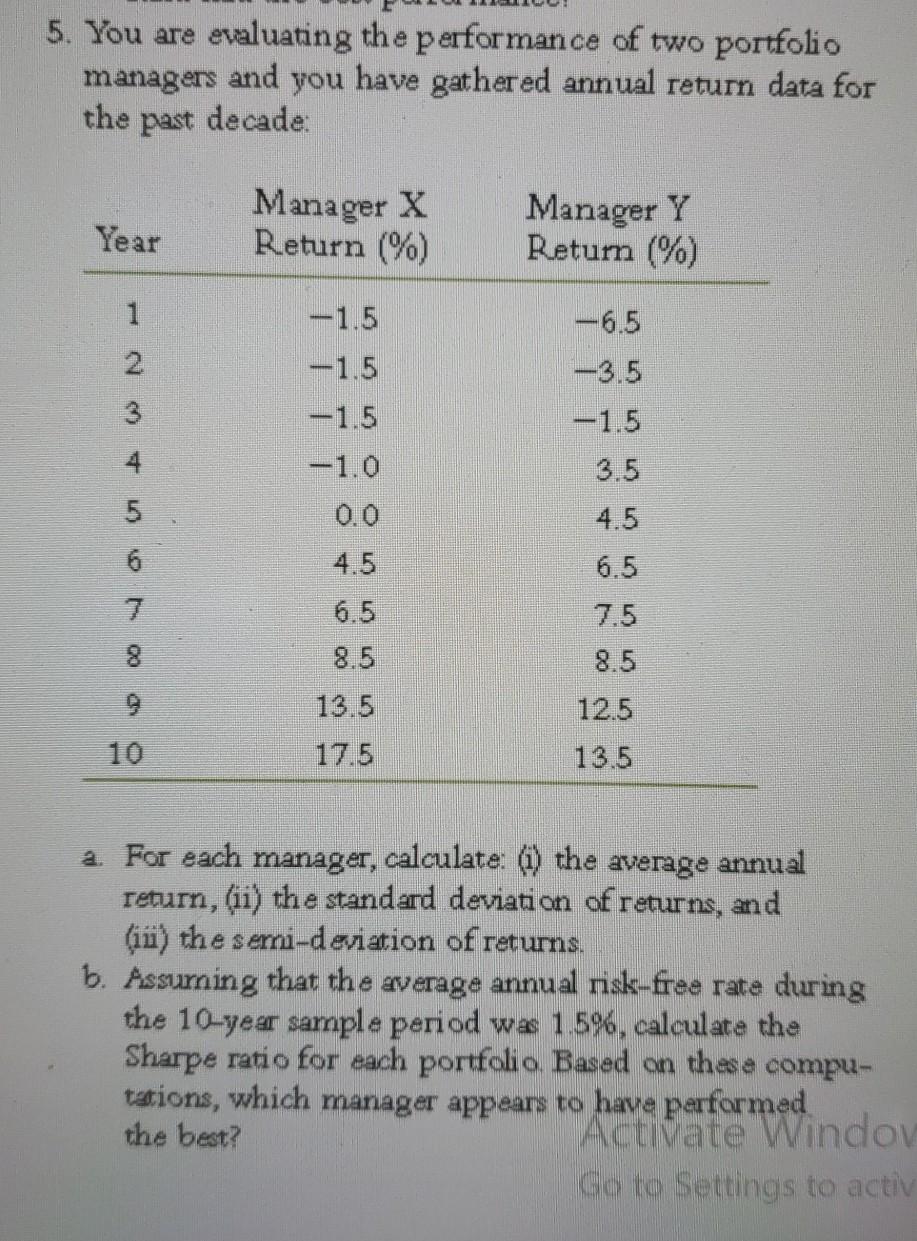
image text in transcribed

5. You are evaluating the performance of two portfolio managers and you have gathered annual return data for the past decade Year Manager X Return (%) Manager Y Retum (%) 1 -1.5 6.5 -3.5 -1.5 -1.5 3 -1.5 4 -1.0 3.5 5 4.5 6 6.5 7 4.5 6.5 8.5 7.5 8.5 8 13.5 12.5 13.5 17.5 a. For each manager, calculate: (1) the average annual return, (ii) the standard deviation of returns, and (ii) the semi-deviation of returns. b. Assurning that the average annual risk-free rate during the 10-year sample period wa 1.5%, calculate the Sharpe ratio for each portfolio Based on these compu- tations, which manager appears to have performed the best? Acuvate Window Go to Settings to activ

Step by Step Solution

There are 3 Steps involved in it

Step: 1

blur-text-image

Get Instant Access to Expert-Tailored Solutions

See step-by-step solutions with expert insights and AI powered tools for academic success

Step: 2

blur-text-image_2

Step: 3

blur-text-image_3

Ace Your Homework with AI

Get the answers you need in no time with our AI-driven, step-by-step assistance

Get Started

Recommended Textbook for

Ebay Tips And Tricks To Increase Your Ebay Sales

Authors: Jessica Wilson

1st Edition

1774854015, 978-1774854013

More Books

Students also viewed these Finance questions

Question

How many stores exceeded the KPI target in March 2015?

Answered: 1 week ago