Question
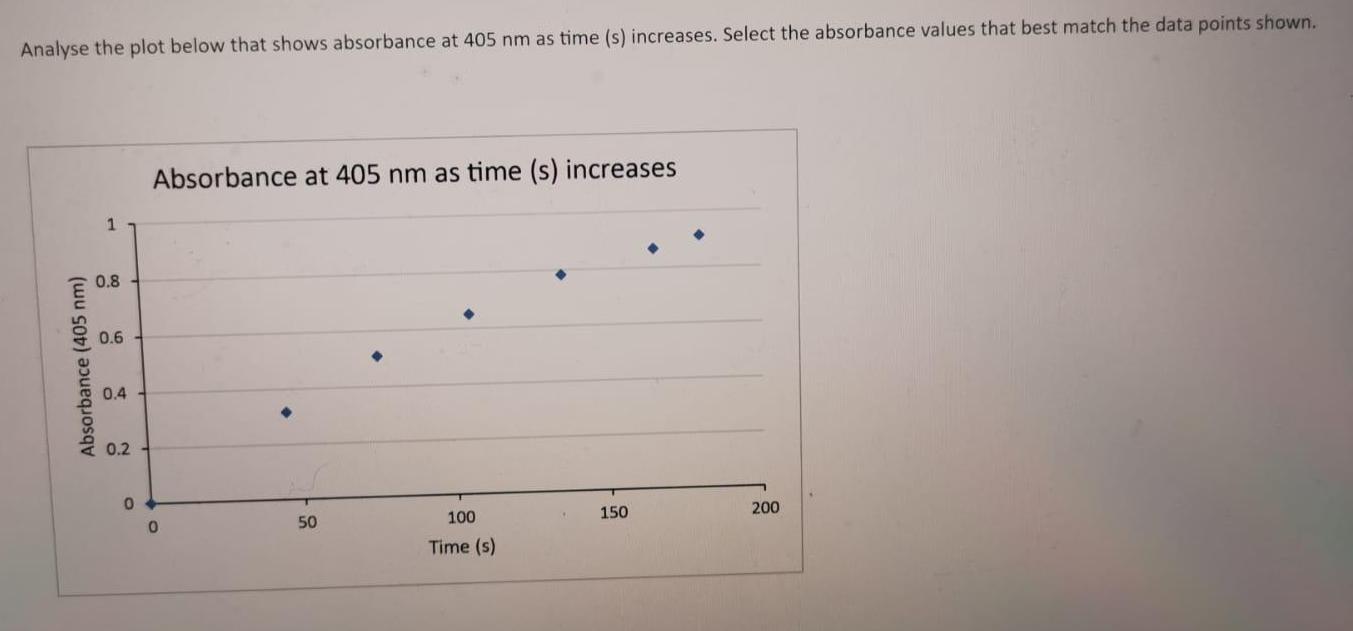
Analyse the plot below that shows absorbance at 405 nm as time (s) increases. Select the absorbance values that best match the data points


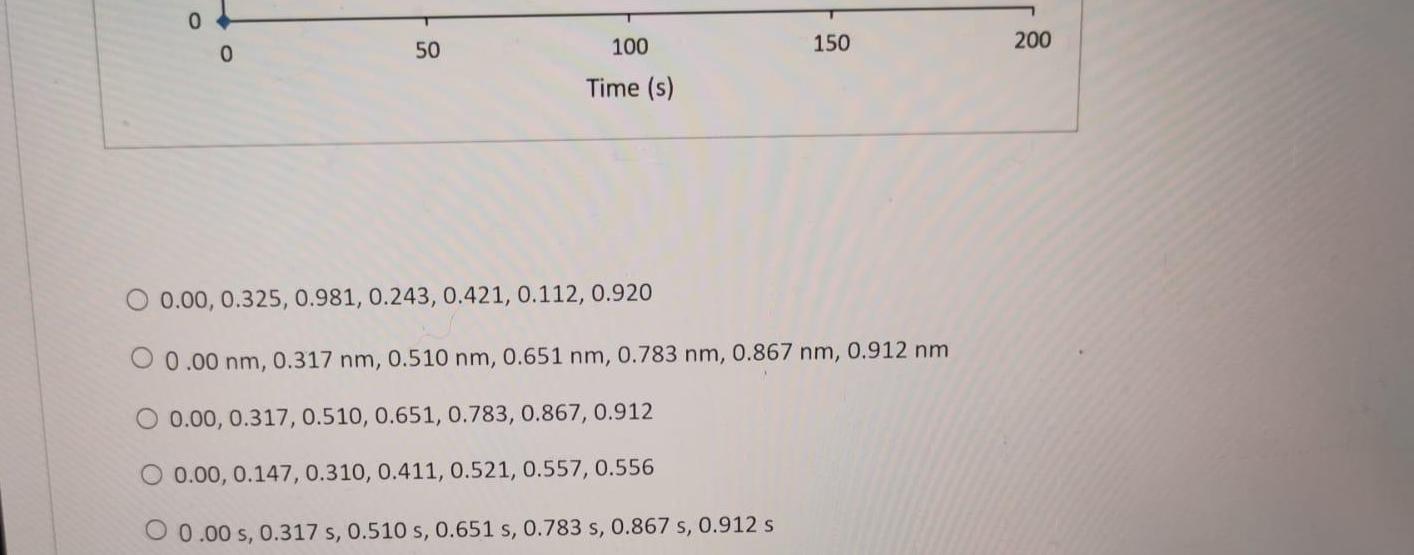
Analyse the plot below that shows absorbance at 405 nm as time (s) increases. Select the absorbance values that best match the data points shown. Absorbance (405 nm) 1 0.8 0.6 0.4 0.2 0 Absorbance at 405 nm as time (s) increases 50 100 Time (s) 150 200 0 0 50 100 Time (s) 150 O 0.00, 0.325, 0.981, 0.243, 0.421, 0.112, 0.920 O 0.00 nm, 0.317 nm, 0.510 nm, 0.651 nm, 0.783 nm, 0.867 nm, 0.912 nm 0.00, 0.317, 0.510, 0.651, 0.783, 0.867, 0.912 O 0.00, 0.147, 0.310, 0.411, 0.521, 0.557, 0.556 O 0.00 s, 0.317 s, 0.510 s, 0.651 s, 0.783 s, 0.867 s, 0.912 s 200
Step by Step Solution
3.58 Rating (162 Votes )
There are 3 Steps involved in it
Step: 1
Solution 00E 073 05 04 03 02 ...
Get Instant Access to Expert-Tailored Solutions
See step-by-step solutions with expert insights and AI powered tools for academic success
Step: 2

Step: 3

Ace Your Homework with AI
Get the answers you need in no time with our AI-driven, step-by-step assistance
Get StartedRecommended Textbook for
Mathematical Applications for the Management Life and Social Sciences
Authors: Ronald J. Harshbarger, James J. Reynolds
11th edition
9781337032247, 9781305465183, 1305108043, 1337032247, 1305465180, 978-1305108042
Students also viewed these Chemistry questions
Question
Answered: 1 week ago
Question
Answered: 1 week ago
Question
Answered: 1 week ago
Question
Answered: 1 week ago
Question
Answered: 1 week ago
Question
Answered: 1 week ago
Question
Answered: 1 week ago
Question
Answered: 1 week ago
Question
Answered: 1 week ago
Question
Answered: 1 week ago
Question
Answered: 1 week ago
Question
Answered: 1 week ago
Question
Answered: 1 week ago
Question
Answered: 1 week ago
Question
Answered: 1 week ago
Question
Answered: 1 week ago
Question
Answered: 1 week ago
Question
Answered: 1 week ago
Question
Answered: 1 week ago
Question
Answered: 1 week ago
View Answer in SolutionInn App


