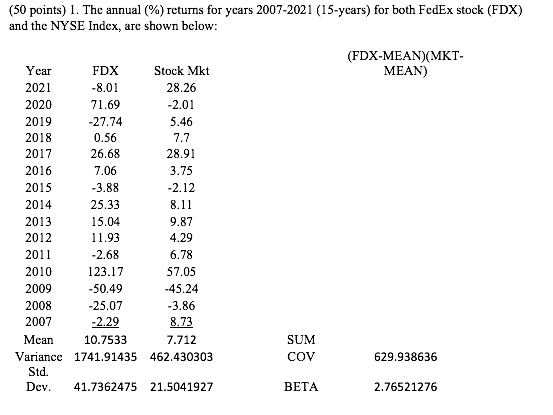

(50 points) 1. The annual (%) returns for years 2007-2021 (15-years) for both FedEx stock (FDX) and the NYSE Index, are shown below: (FDX-MEAN)(MKT- Year FDX Stock Mkt MEAN) 2021 -8.01 28.26 2020 71.69 -2.01 2019 -27.74 5.46 2018 0.56 7.7 2017 26.68 28.91 2016 7.06 3.75 2015 -3.88 -2.12 2014 25.33 8.11 2013 15.04 9.87 2012 11.93 4.29 2011 -2.68 6.78 2010 123.17 57.05 2009 -50.49 -45.24 2008 -25.07 -3.86 2007 -2.29 8.73 Mean 10.7533 7.712 SUM Variance 1741.91435 462.430303 COV 629.938636 Std. Dev. 41.7362475 21.5041927 BETA 2.76521276 c. Using the US Treasury Bond yield curve for Friday, 11/5/21 (given below) and the parameters for the Capital Asset Pricing Model (CAPM) that were defined by Pablo Fernandez for 2021 (use 10-year Treasury rate for risk free rate and a Market Risk Premium of 5.5%), calculate the minimum required rate of return that investors require for FDX stock as estimated by the CAPM. Date 1 Mo 0.05 2 Mo 0.06 3 Mo 0.05 6 Mo 0.07 1 Yr 0.14 2 Yr 0.39 3 Yr 0.66 5 Yr 1.04 7 Yr 1.3 10 Yr 1.45 20 Yr 1.8B 30 Yr 1.87 11/5/2021 (50 points) 1. The annual (%) returns for years 2007-2021 (15-years) for both FedEx stock (FDX) and the NYSE Index, are shown below: (FDX-MEAN)(MKT- Year FDX Stock Mkt MEAN) 2021 -8.01 28.26 2020 71.69 -2.01 2019 -27.74 5.46 2018 0.56 7.7 2017 26.68 28.91 2016 7.06 3.75 2015 -3.88 -2.12 2014 25.33 8.11 2013 15.04 9.87 2012 11.93 4.29 2011 -2.68 6.78 2010 123.17 57.05 2009 -50.49 -45.24 2008 -25.07 -3.86 2007 -2.29 8.73 Mean 10.7533 7.712 SUM Variance 1741.91435 462.430303 COV 629.938636 Std. Dev. 41.7362475 21.5041927 BETA 2.76521276 c. Using the US Treasury Bond yield curve for Friday, 11/5/21 (given below) and the parameters for the Capital Asset Pricing Model (CAPM) that were defined by Pablo Fernandez for 2021 (use 10-year Treasury rate for risk free rate and a Market Risk Premium of 5.5%), calculate the minimum required rate of return that investors require for FDX stock as estimated by the CAPM. Date 1 Mo 0.05 2 Mo 0.06 3 Mo 0.05 6 Mo 0.07 1 Yr 0.14 2 Yr 0.39 3 Yr 0.66 5 Yr 1.04 7 Yr 1.3 10 Yr 1.45 20 Yr 1.8B 30 Yr 1.87 11/5/2021


