Question
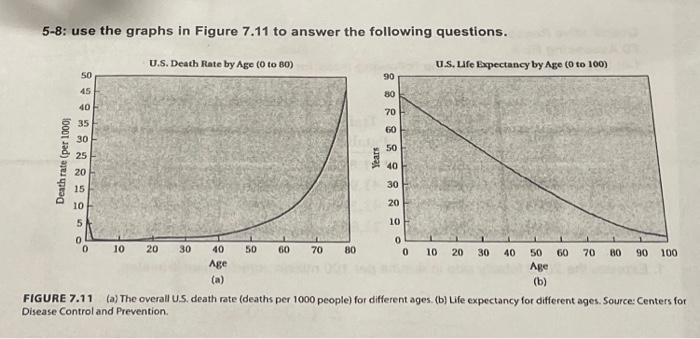
5-8: use the graphs in Figure 7.11 to answer the following questions. U.S. Death Rate by Age (0 to 80) Death rate (per 1000


5-8: use the graphs in Figure 7.11 to answer the following questions. U.S. Death Rate by Age (0 to 80) Death rate (per 1000 U.S. Life Expectancy by Age (0 to 100) 50 45 40 35 30 90 80 70 60 25 Years 50 40 30 15 10 20 5 10 0 0 10 20 30 40 50 60 70 80 0 10 20 Age 30 40 50 60 Age 70 70 (a) FIGURE 7.11 (b) (a) The overall U.S. death rate (deaths per 1000 people) for different ages. (b) Life expectancy for different ages. Source: Centers for Disease Control and Prevention. 80 90 100 7. To what age could the average 40-year-old expect to live? 8. At what average age will today's 80-year-olds die? Assume no changes to life expectancies over the next 20 years.
Step by Step Solution
There are 3 Steps involved in it
Step: 1

Get Instant Access to Expert-Tailored Solutions
See step-by-step solutions with expert insights and AI powered tools for academic success
Step: 2

Step: 3

Ace Your Homework with AI
Get the answers you need in no time with our AI-driven, step-by-step assistance
Get StartedRecommended Textbook for
Statistical Reasoning For Everyday Life
Authors: Jeff Bennett, William Briggs, Mario Triola
5th Edition
9780134494043
Students also viewed these Mathematics questions
Question
Answered: 1 week ago
Question
Answered: 1 week ago
Question
Answered: 1 week ago
Question
Answered: 1 week ago
Question
Answered: 1 week ago
Question
Answered: 1 week ago
Question
Answered: 1 week ago
Question
Answered: 1 week ago
Question
Answered: 1 week ago
Question
Answered: 1 week ago
Question
Answered: 1 week ago
Question
Answered: 1 week ago
Question
Answered: 1 week ago
Question
Answered: 1 week ago
Question
Answered: 1 week ago
Question
Answered: 1 week ago
Question
Answered: 1 week ago
Question
Answered: 1 week ago
Question
Answered: 1 week ago
Question
Answered: 1 week ago
Question
Answered: 1 week ago
View Answer in SolutionInn App


