Answered step by step
Verified Expert Solution
Question
1 Approved Answer
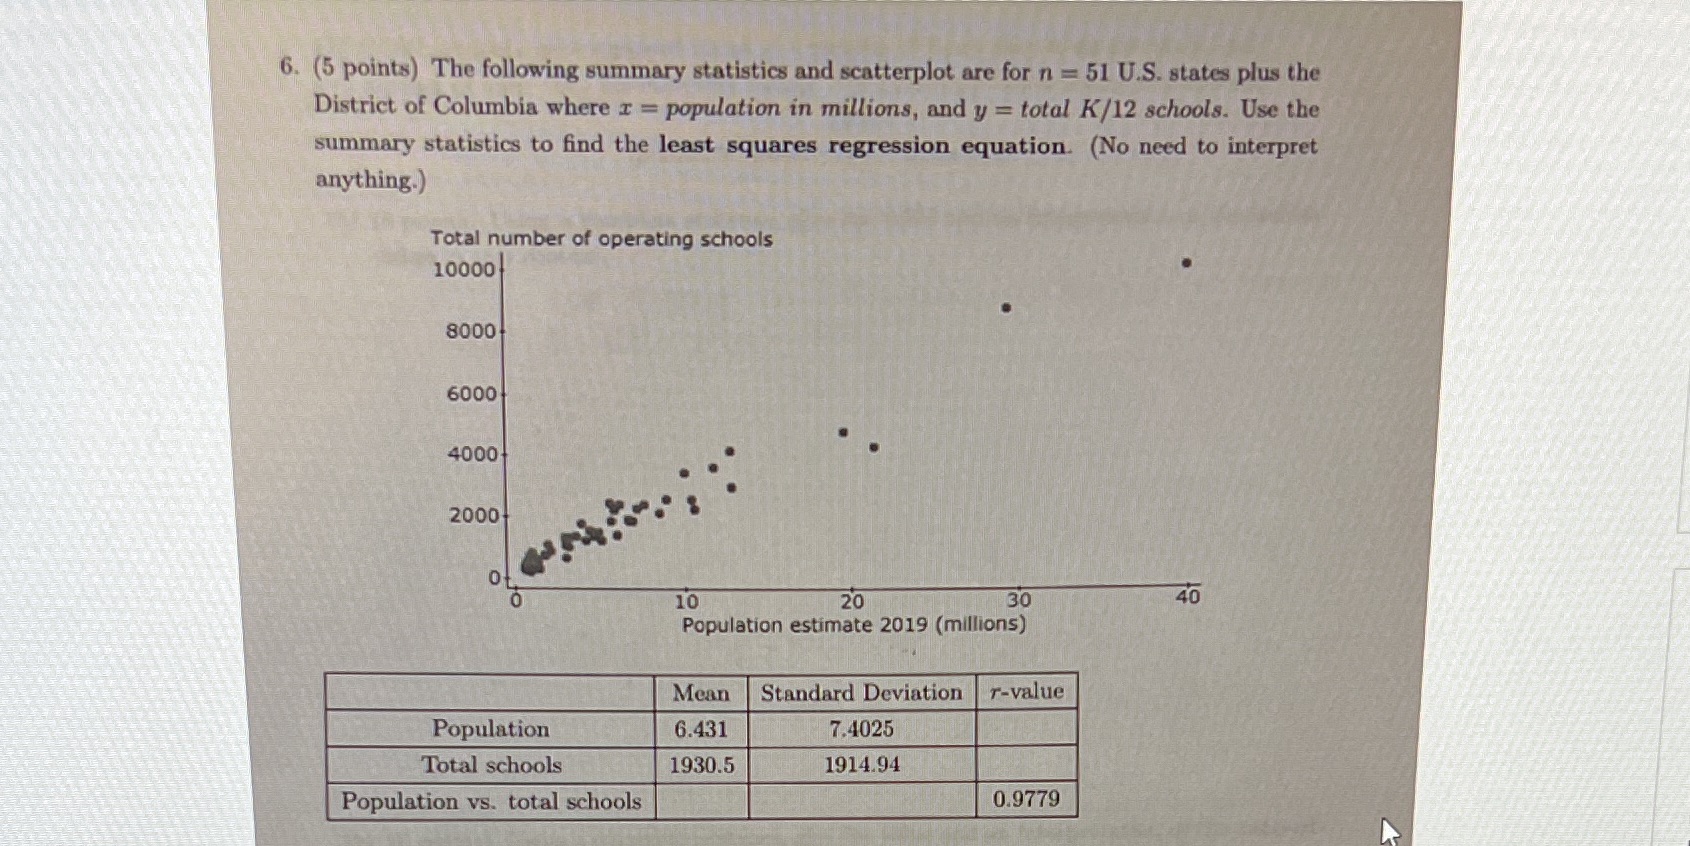
6. (5 points) The following summary statistics and scatterplot are for n=51 U.S. states plus the District of Columbia where x = population in

6. (5 points) The following summary statistics and scatterplot are for n=51 U.S. states plus the District of Columbia where x = population in millions, and y = total K/12 schools. Use the summary statistics to find the least squares regression equation. (No need to interpret anything.) Total number of operating schools 10000 8000 6000 4000- 2000 Population Total schools Population vs. total schools 10 20 30 Population estimate 2019 (millions) Mean Standard Deviation r-value 6.431 1930.5. 7.4025 1914.94 0.9779 46 40
Step by Step Solution
There are 3 Steps involved in it
Step: 1

Get Instant Access to Expert-Tailored Solutions
See step-by-step solutions with expert insights and AI powered tools for academic success
Step: 2

Step: 3

Ace Your Homework with AI
Get the answers you need in no time with our AI-driven, step-by-step assistance
Get Started


