

Answered step by step
Verified Expert Solution
Question
1 Approved Answer
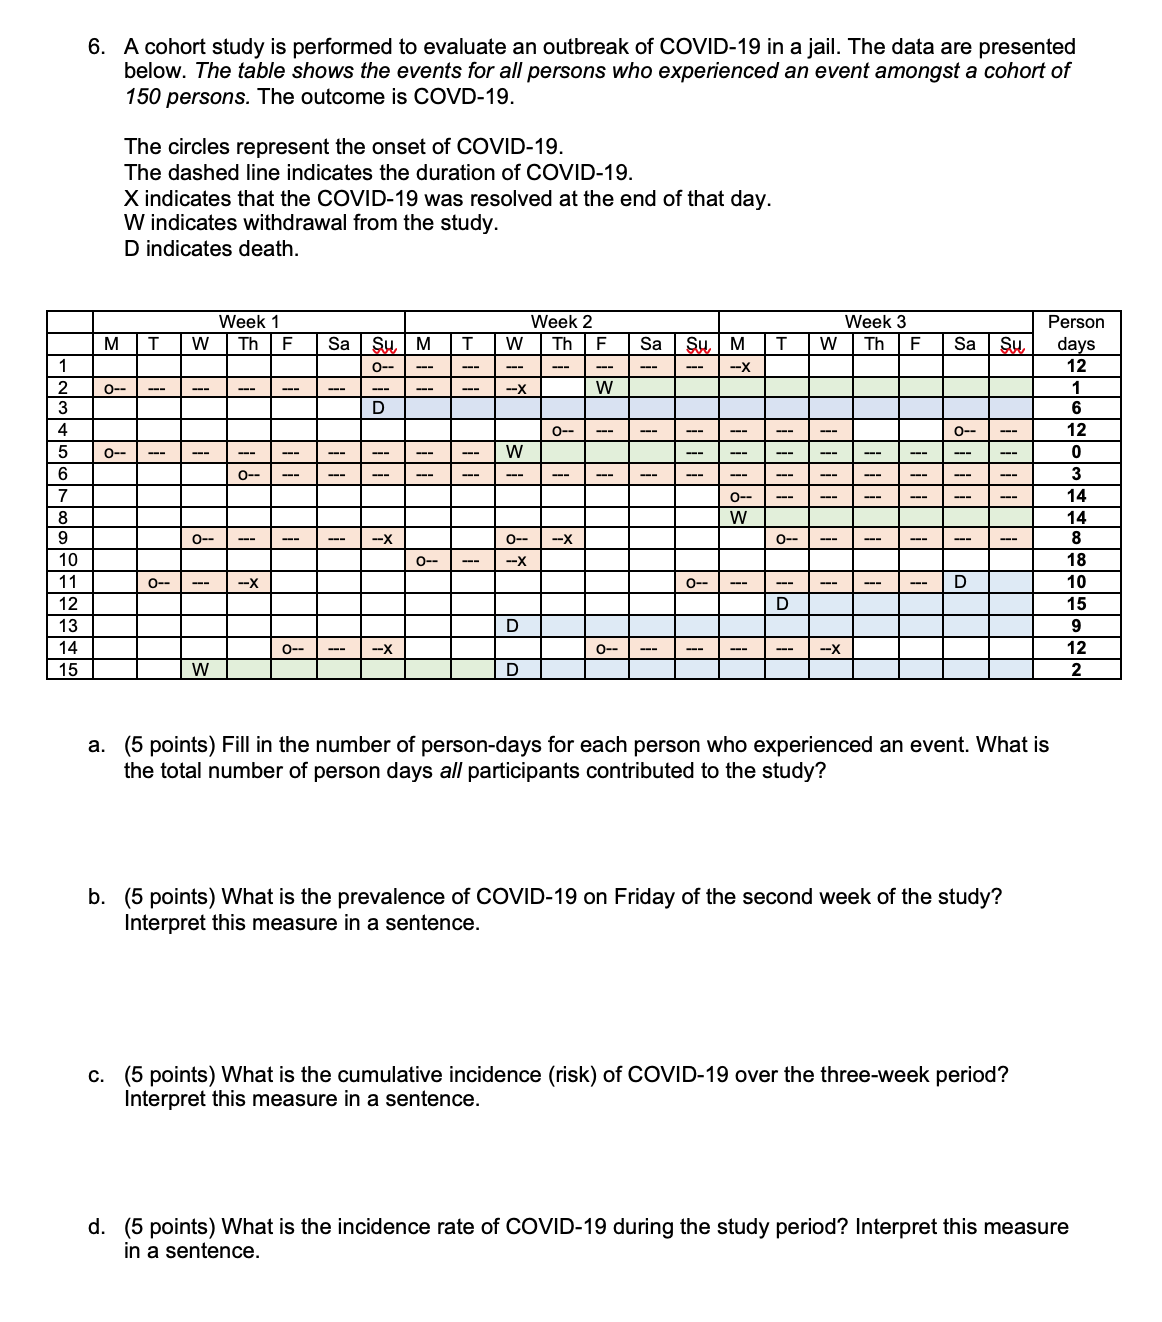
6. A cohort study is performed to evaluate an outbreak of COVID-19 in a jail. The data are presented below. The table shows the events
Step by Step Solution
There are 3 Steps involved in it
Step: 1

Get Instant Access to Expert-Tailored Solutions
See step-by-step solutions with expert insights and AI powered tools for academic success
Step: 2

Step: 3
Ace Your Homework with AI
Get the answers you need in no time with our AI-driven, step-by-step assistance
Get Started
Precalculus (Subscription)
Authors: Michael Sullivan
9th Edition
0321830695, 9780321830692