

Answered step by step
Verified Expert Solution
Question
1 Approved Answer
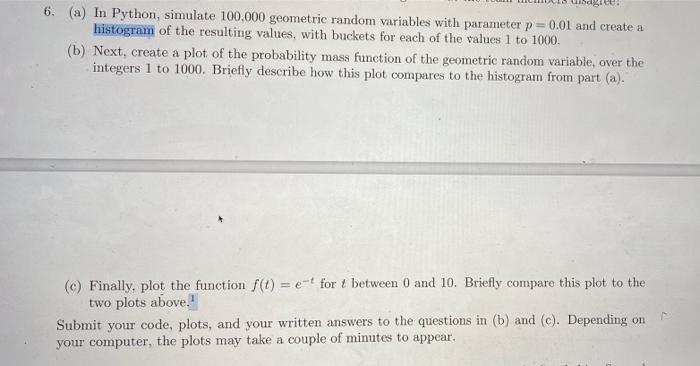
6. (a) In Python, simulate 100,000 geometric random variables with parameter p = 0.01 and create a histogram of the resulting values, with buckets for
Step by Step Solution
There are 3 Steps involved in it
Step: 1

Get Instant Access to Expert-Tailored Solutions
See step-by-step solutions with expert insights and AI powered tools for academic success
Step: 2

Step: 3
Ace Your Homework with AI
Get the answers you need in no time with our AI-driven, step-by-step assistance
Get Started
Hands On Database
Authors: Steve Conger
1st Edition
013610827X, 978-0136108276