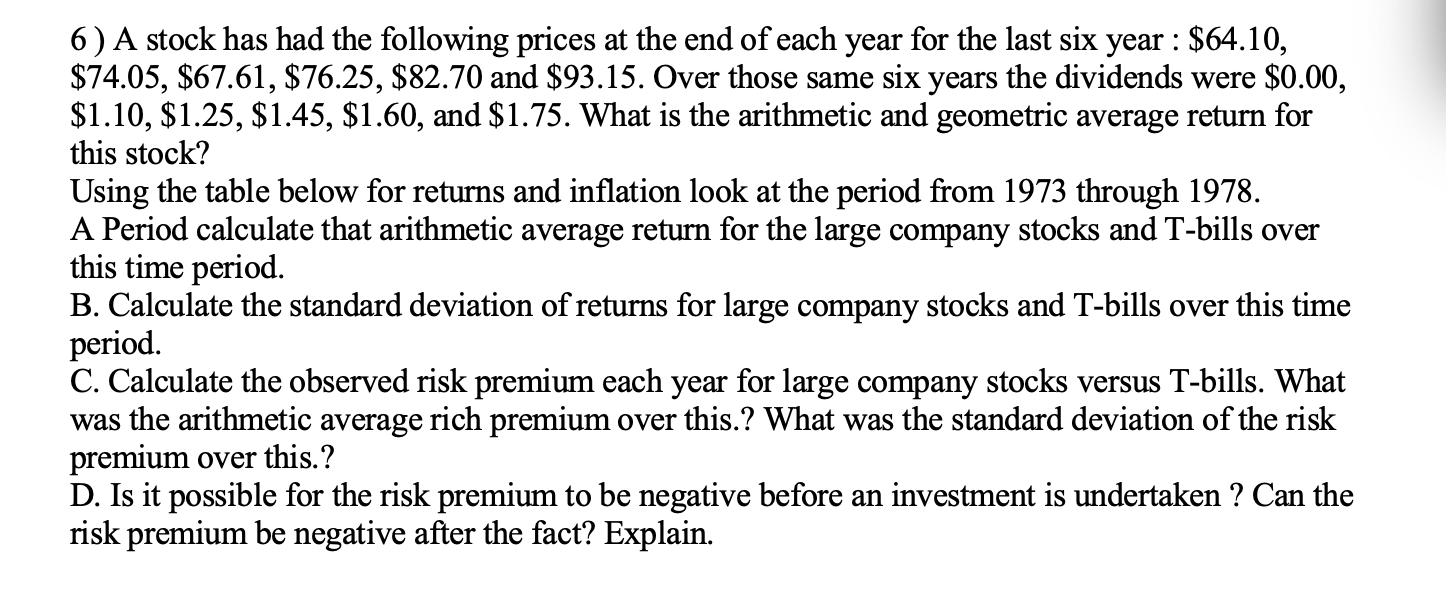
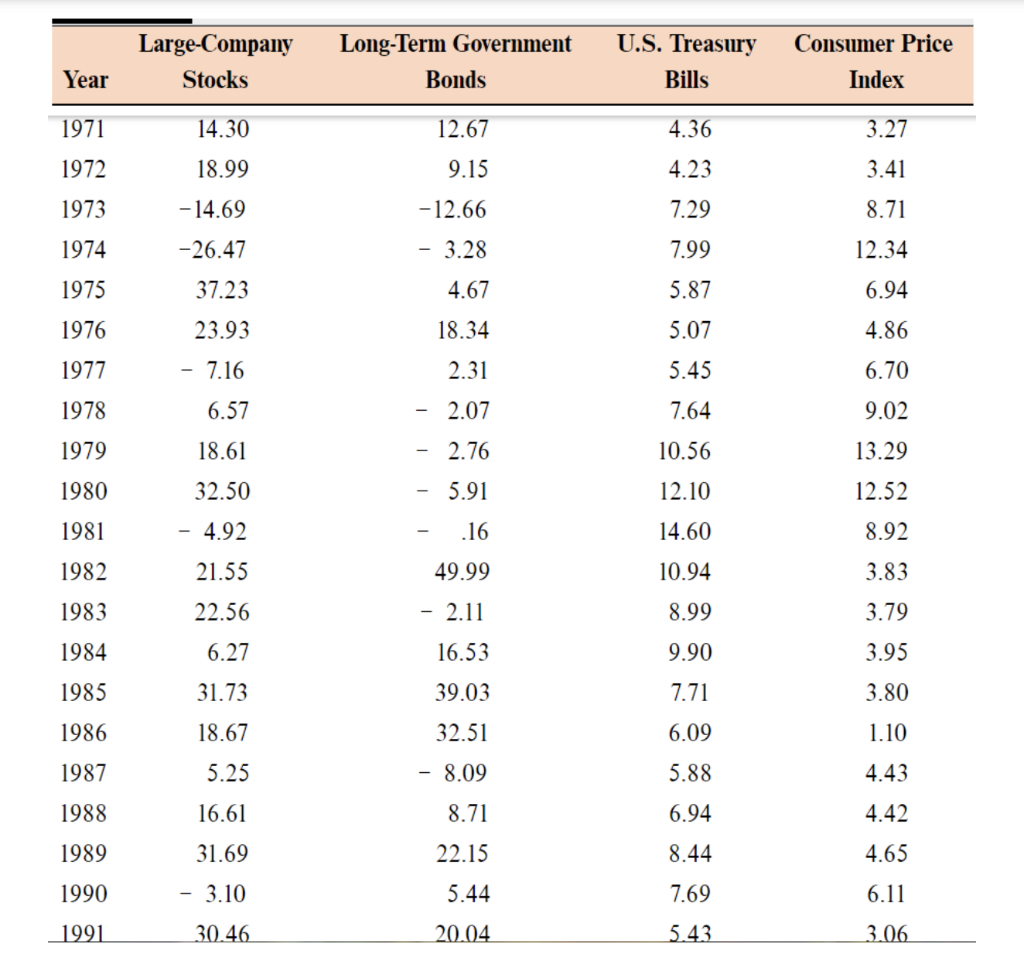
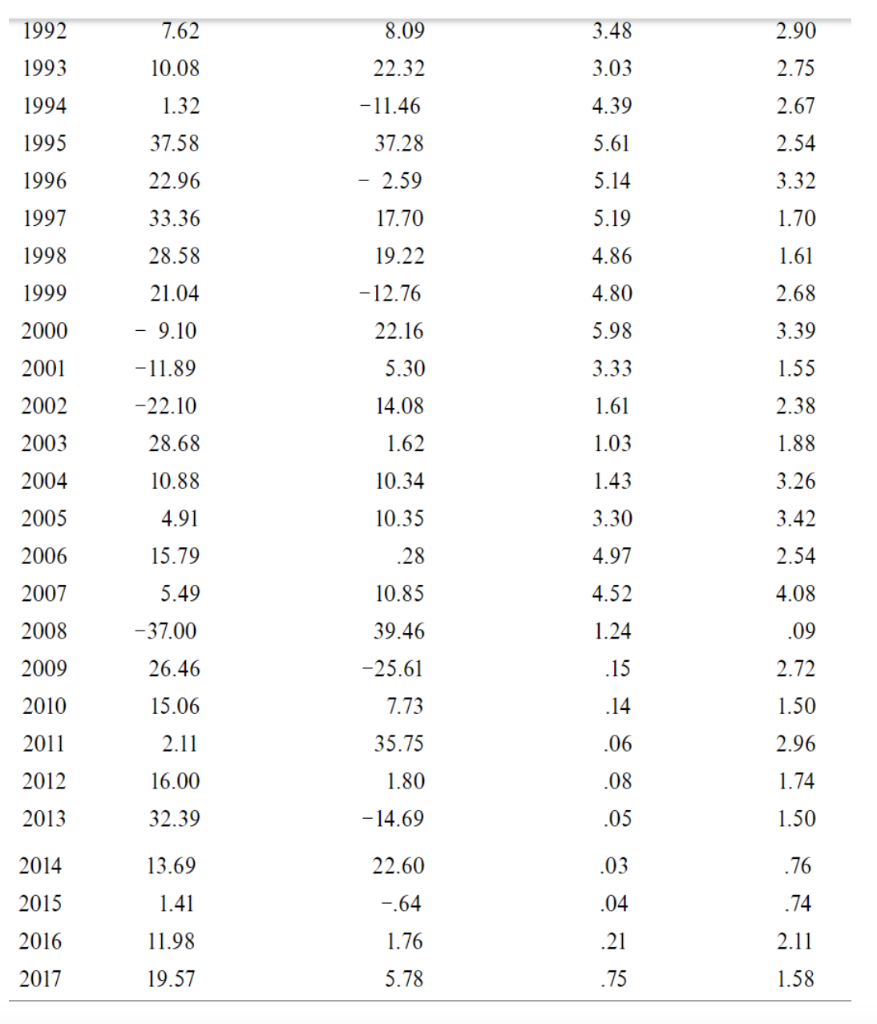
6) A stock has had the following prices at the end of each year for the last six year : $64.10, $74.05, $67.61, $76.25, $82.70 and $93.15. Over those same six years the dividends were $0.00, $1.10, $1.25, $1.45, $1.60, and $1.75. What is the arithmetic and geometric average return for this stock? Using the table below for returns and inflation look at the period from 1973 through 1978. A Period calculate that arithmetic average return for the large company stocks and T-bills over this time period. B. Calculate the standard deviation of returns for large company stocks and T-bills over this time period. C. Calculate the observed risk premium each year for large company stocks versus T-bills. What was the arithmetic average rich premium over this.? What was the standard deviation of the risk premium over this.? D. Is it possible for the risk premium to be negative before an investment is undertaken ? Can the risk premium be negative after the fact? Explain. 1992 7.62 8.09 3.48 2.90 1993 10.08 22.32 3.03 2.75 1994 1.32 -11.46 4.39 2.67 1995 37.58 37.28 5.61 2.54 1996 22.96 - 2.59 5.14 3.32 1997 33.36 17.70 5.19 1.70 1998 28.58 19.22 4.86 1.61 1999 21.04 -12.76 4.80 2.68 2000 - 9.10 22.16 5.98 3.39 -11.89 5.30 3.33 1.55 2001 2002 -22.10 14.08 1.61 2.38 2003 28.68 1.62 1.03 1.88 2004 10.88 10.34 1.43 3.26 2005 4.91 10.35 3.30 3.42 2006 15.79 .28 4.97 2.54 2007 5.49 10.85 4.52 4.08 2008 - 37.00 39.46 1.24 .09 2009 26.46 -25.61 .15 2.72 2010 15.06 7.73 .14 1.50 2011 2.11 35.75 .06 2.96 2012 16.00 1.80 .08 1.74 2013 32.39 - 14.69 .05 1.50 2014 13.69 22.60 .03 .76 2015 1.41 --64 .04 .74 2016 11.98 1.76 .21 2.11 2017 19.57 5.78 .75 1.58 6) A stock has had the following prices at the end of each year for the last six year : $64.10, $74.05, $67.61, $76.25, $82.70 and $93.15. Over those same six years the dividends were $0.00, $1.10, $1.25, $1.45, $1.60, and $1.75. What is the arithmetic and geometric average return for this stock? Using the table below for returns and inflation look at the period from 1973 through 1978. A Period calculate that arithmetic average return for the large company stocks and T-bills over this time period. B. Calculate the standard deviation of returns for large company stocks and T-bills over this time period. C. Calculate the observed risk premium each year for large company stocks versus T-bills. What was the arithmetic average rich premium over this.? What was the standard deviation of the risk premium over this.? D. Is it possible for the risk premium to be negative before an investment is undertaken ? Can the risk premium be negative after the fact? Explain. 1992 7.62 8.09 3.48 2.90 1993 10.08 22.32 3.03 2.75 1994 1.32 -11.46 4.39 2.67 1995 37.58 37.28 5.61 2.54 1996 22.96 - 2.59 5.14 3.32 1997 33.36 17.70 5.19 1.70 1998 28.58 19.22 4.86 1.61 1999 21.04 -12.76 4.80 2.68 2000 - 9.10 22.16 5.98 3.39 -11.89 5.30 3.33 1.55 2001 2002 -22.10 14.08 1.61 2.38 2003 28.68 1.62 1.03 1.88 2004 10.88 10.34 1.43 3.26 2005 4.91 10.35 3.30 3.42 2006 15.79 .28 4.97 2.54 2007 5.49 10.85 4.52 4.08 2008 - 37.00 39.46 1.24 .09 2009 26.46 -25.61 .15 2.72 2010 15.06 7.73 .14 1.50 2011 2.11 35.75 .06 2.96 2012 16.00 1.80 .08 1.74 2013 32.39 - 14.69 .05 1.50 2014 13.69 22.60 .03 .76 2015 1.41 --64 .04 .74 2016 11.98 1.76 .21 2.11 2017 19.57 5.78 .75 1.58