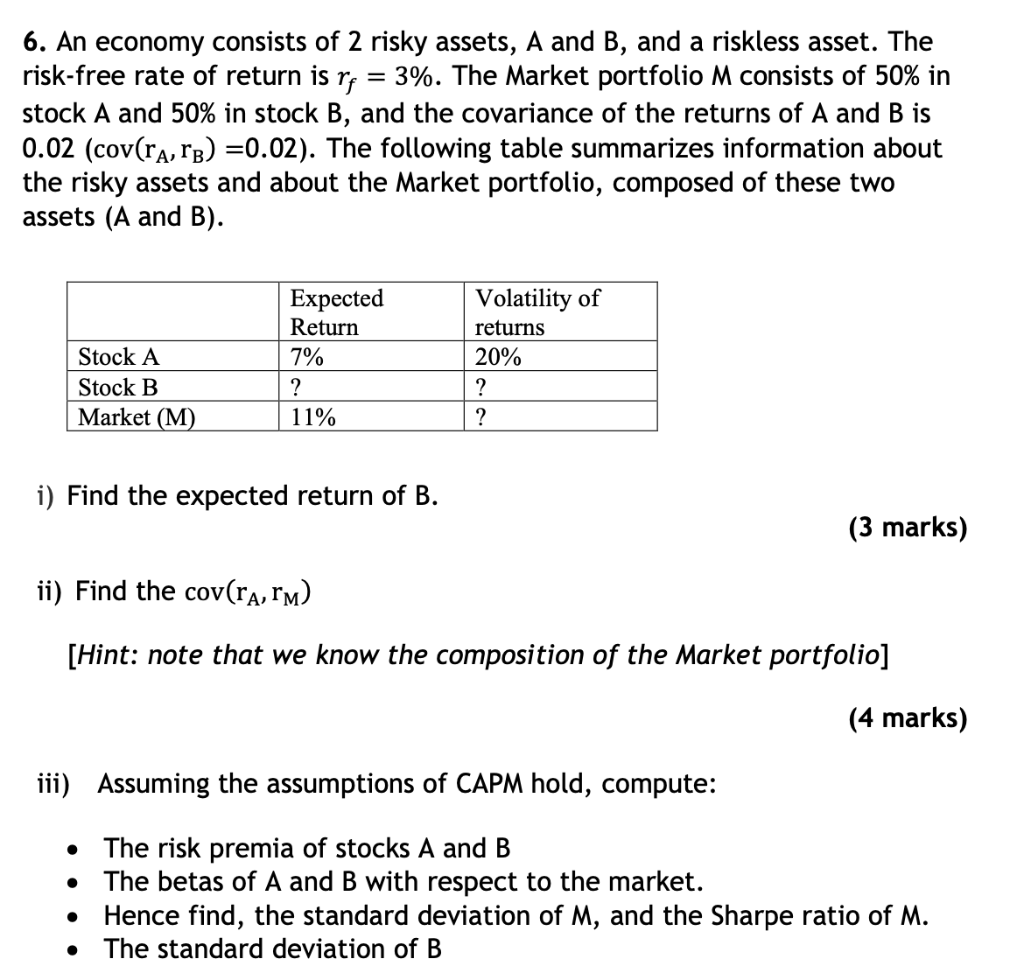
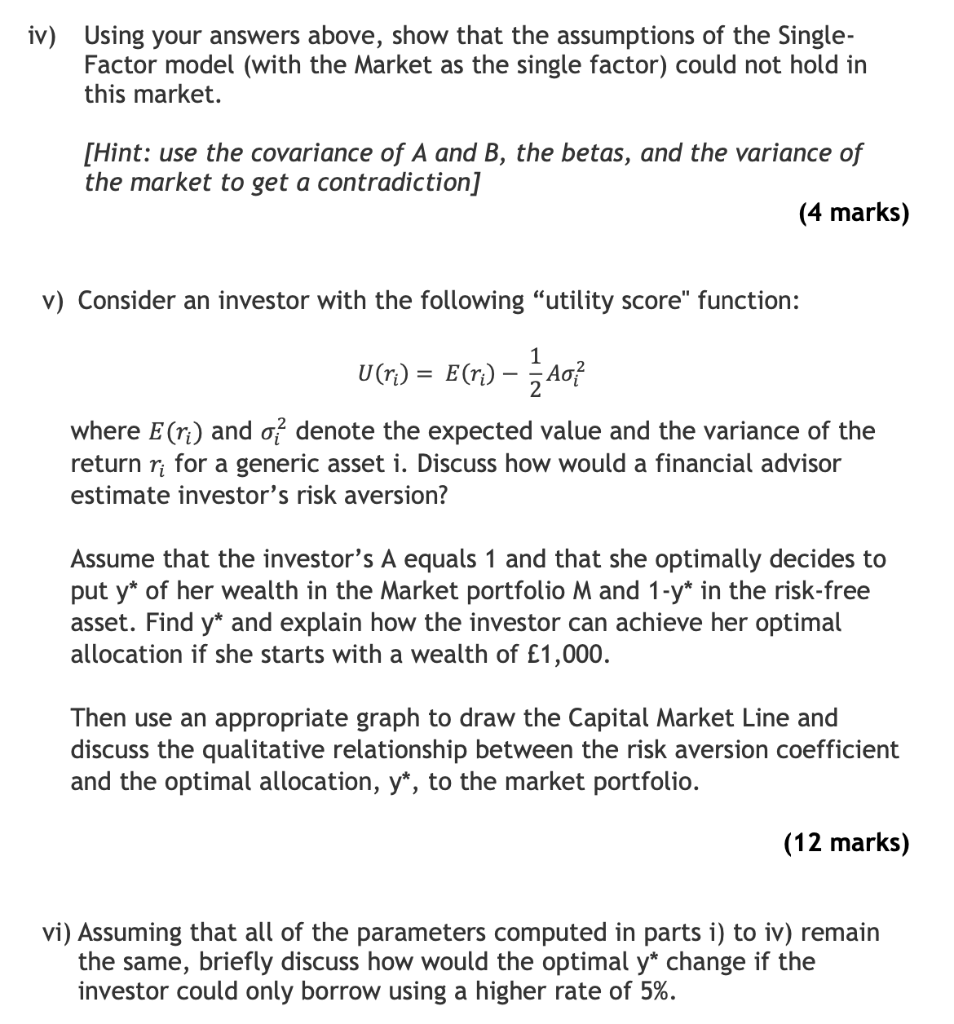
6. An economy consists of 2 risky assets, A and B, and a riskless asset. The risk-free rate of return is rf=3%. The Market portfolio M consists of 50% in stock A and 50% in stock B, and the covariance of the returns of A and B is 0.02(cov(rA,rB)=0.02). The following table summarizes information about the risky assets and about the Market portfolio, composed of these two assets (A and B). i) Find the expected return of B. (3 marks) ii) Find the cov(rA,rM) [Hint: note that we know the composition of the Market portfolio] (4 marks) iii) Assuming the assumptions of CAPM hold, compute: - The risk premia of stocks A and B - The betas of A and B with respect to the market. - Hence find, the standard deviation of M, and the Sharpe ratio of M. - The standard deviation of B iv) Using your answers above, show that the assumptions of the SingleFactor model (with the Market as the single factor) could not hold in this market. [Hint: use the covariance of A and B, the betas, and the variance of the market to get a contradiction] (4 marks) v) Consider an investor with the following "utility score" function: U(ri)=E(ri)21Ai2 where E(ri) and i2 denote the expected value and the variance of the return ri for a generic asset i. Discuss how would a financial advisor estimate investor's risk aversion? Assume that the investor's A equals 1 and that she optimally decides to put y of her wealth in the Market portfolio M and 1y in the risk-free asset. Find y and explain how the investor can achieve her optimal allocation if she starts with a wealth of 1,000. Then use an appropriate graph to draw the Capital Market Line and discuss the qualitative relationship between the risk aversion coefficient and the optimal allocation, y, to the market portfolio. (12 marks) vi) Assuming that all of the parameters computed in parts i) to iv) remain the same, briefly discuss how would the optimal y change if the investor could only borrow using a higher rate of 5%. 6. An economy consists of 2 risky assets, A and B, and a riskless asset. The risk-free rate of return is rf=3%. The Market portfolio M consists of 50% in stock A and 50% in stock B, and the covariance of the returns of A and B is 0.02(cov(rA,rB)=0.02). The following table summarizes information about the risky assets and about the Market portfolio, composed of these two assets (A and B). i) Find the expected return of B. (3 marks) ii) Find the cov(rA,rM) [Hint: note that we know the composition of the Market portfolio] (4 marks) iii) Assuming the assumptions of CAPM hold, compute: - The risk premia of stocks A and B - The betas of A and B with respect to the market. - Hence find, the standard deviation of M, and the Sharpe ratio of M. - The standard deviation of B iv) Using your answers above, show that the assumptions of the SingleFactor model (with the Market as the single factor) could not hold in this market. [Hint: use the covariance of A and B, the betas, and the variance of the market to get a contradiction] (4 marks) v) Consider an investor with the following "utility score" function: U(ri)=E(ri)21Ai2 where E(ri) and i2 denote the expected value and the variance of the return ri for a generic asset i. Discuss how would a financial advisor estimate investor's risk aversion? Assume that the investor's A equals 1 and that she optimally decides to put y of her wealth in the Market portfolio M and 1y in the risk-free asset. Find y and explain how the investor can achieve her optimal allocation if she starts with a wealth of 1,000. Then use an appropriate graph to draw the Capital Market Line and discuss the qualitative relationship between the risk aversion coefficient and the optimal allocation, y, to the market portfolio. (12 marks) vi) Assuming that all of the parameters computed in parts i) to iv) remain the same, briefly discuss how would the optimal y change if the investor could only borrow using a higher rate of 5%