Answered step by step
Verified Expert Solution
Question
1 Approved Answer
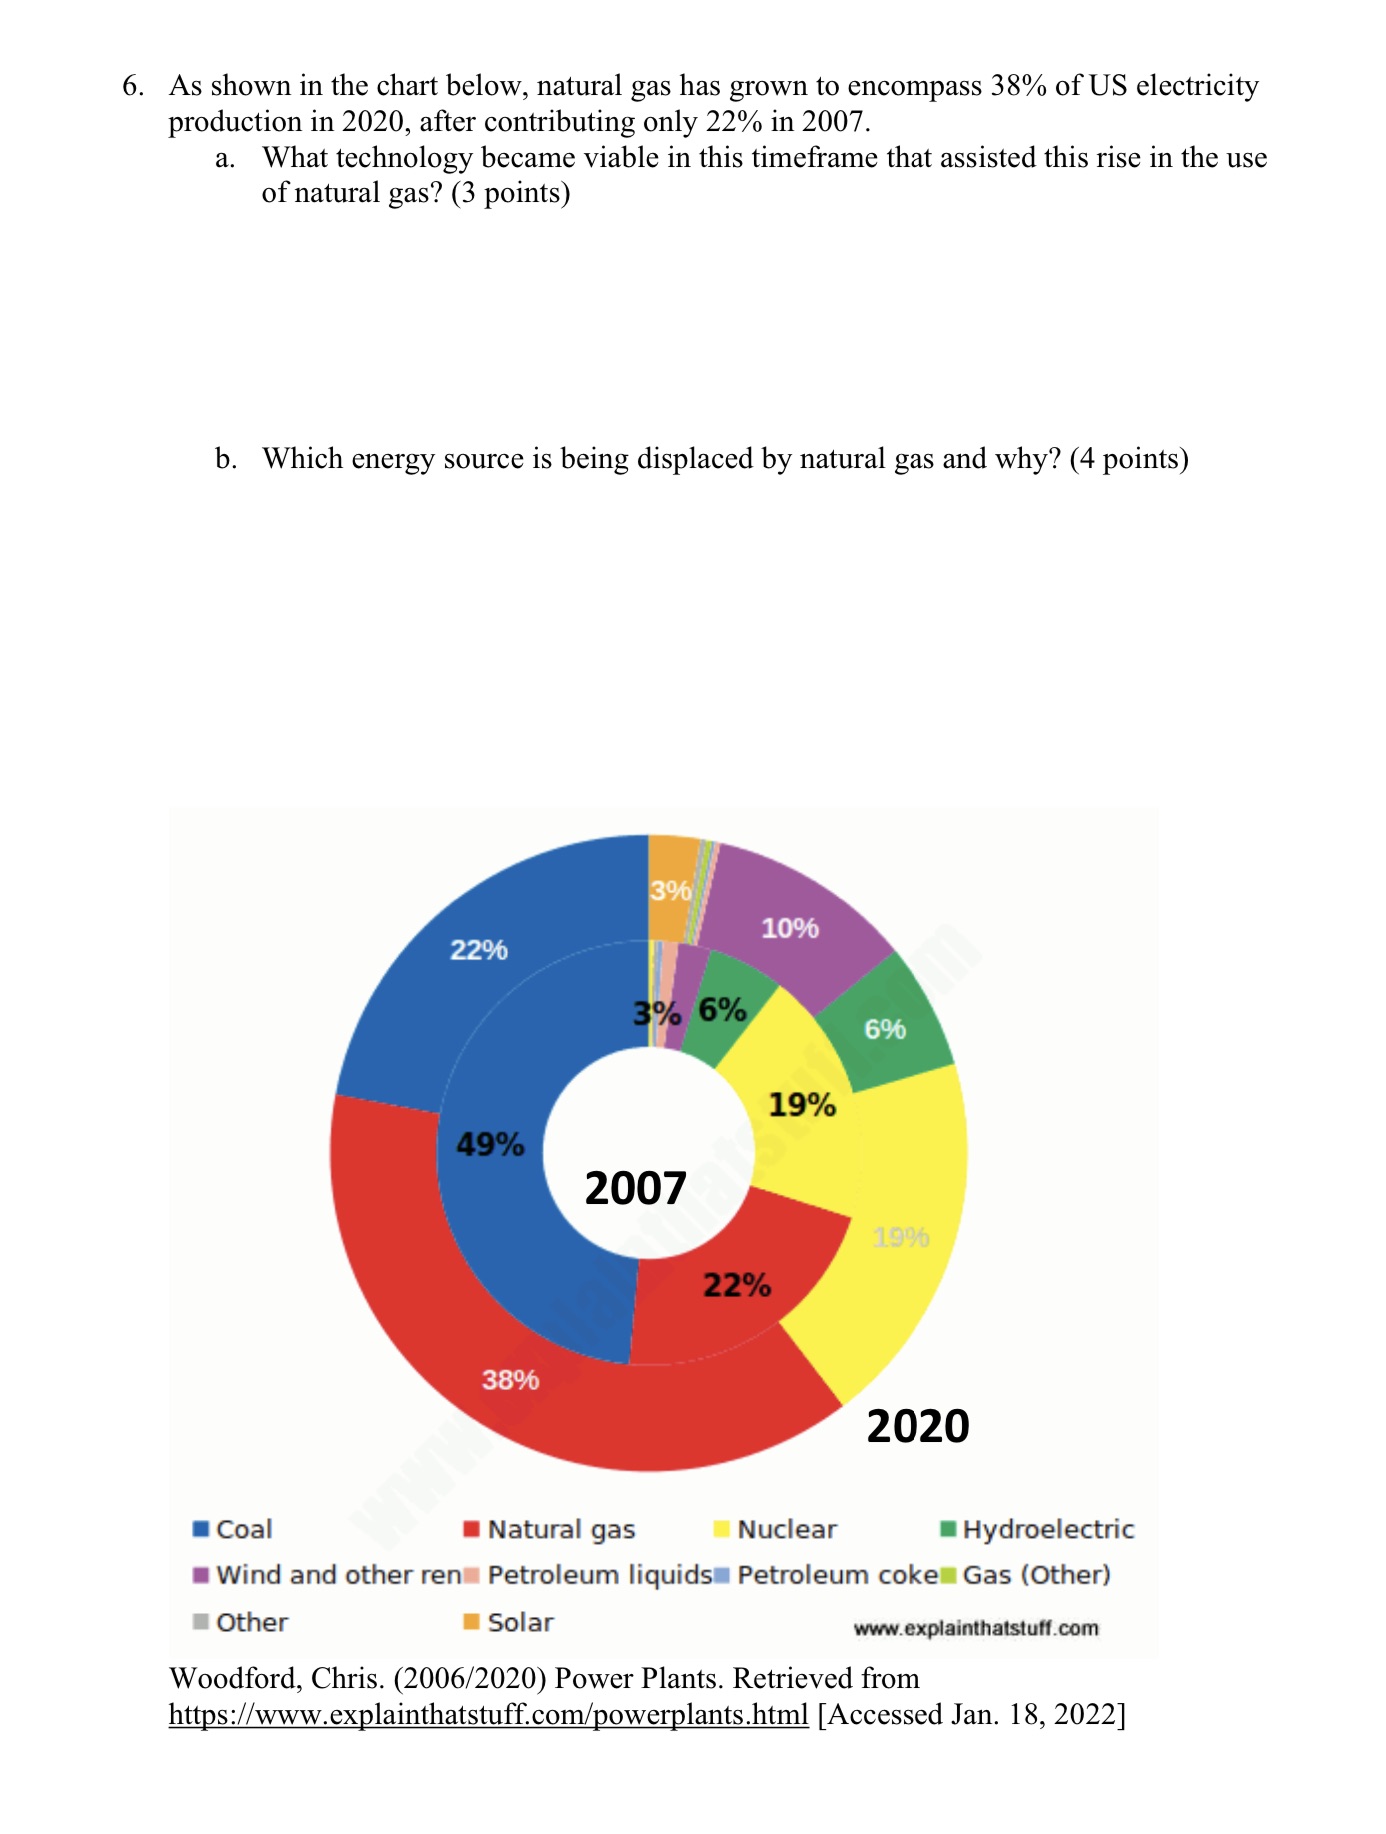
6. As shown in the chart below, natural gas has grown to encompass 38% of US electricity production in 2020, after contributing only 22%

6. As shown in the chart below, natural gas has grown to encompass 38% of US electricity production in 2020, after contributing only 22% in 2007. a. What technology became viable in this timeframe that assisted this rise in the use of natural gas? (3 points) b. Which energy source is being displaced by natural gas and why? (4 points) 3% 10% 22% 3% 6% 6% 19% 49% 2007 38% 19% 22% 2020 Coal Natural gas Nuclear Hydroelectric Wind and other ren Petroleum liquids Petroleum coke Gas (Other) Other Solar www.explainthatstuff.com Woodford, Chris. (2006/2020) Power Plants. Retrieved from https://www.explainthatstuff.com/powerplants.html [Accessed Jan. 18, 2022]
Step by Step Solution
There are 3 Steps involved in it
Step: 1

Get Instant Access to Expert-Tailored Solutions
See step-by-step solutions with expert insights and AI powered tools for academic success
Step: 2

Step: 3

Ace Your Homework with AI
Get the answers you need in no time with our AI-driven, step-by-step assistance
Get Started


