

Answered step by step
Verified Expert Solution
Question
1 Approved Answer
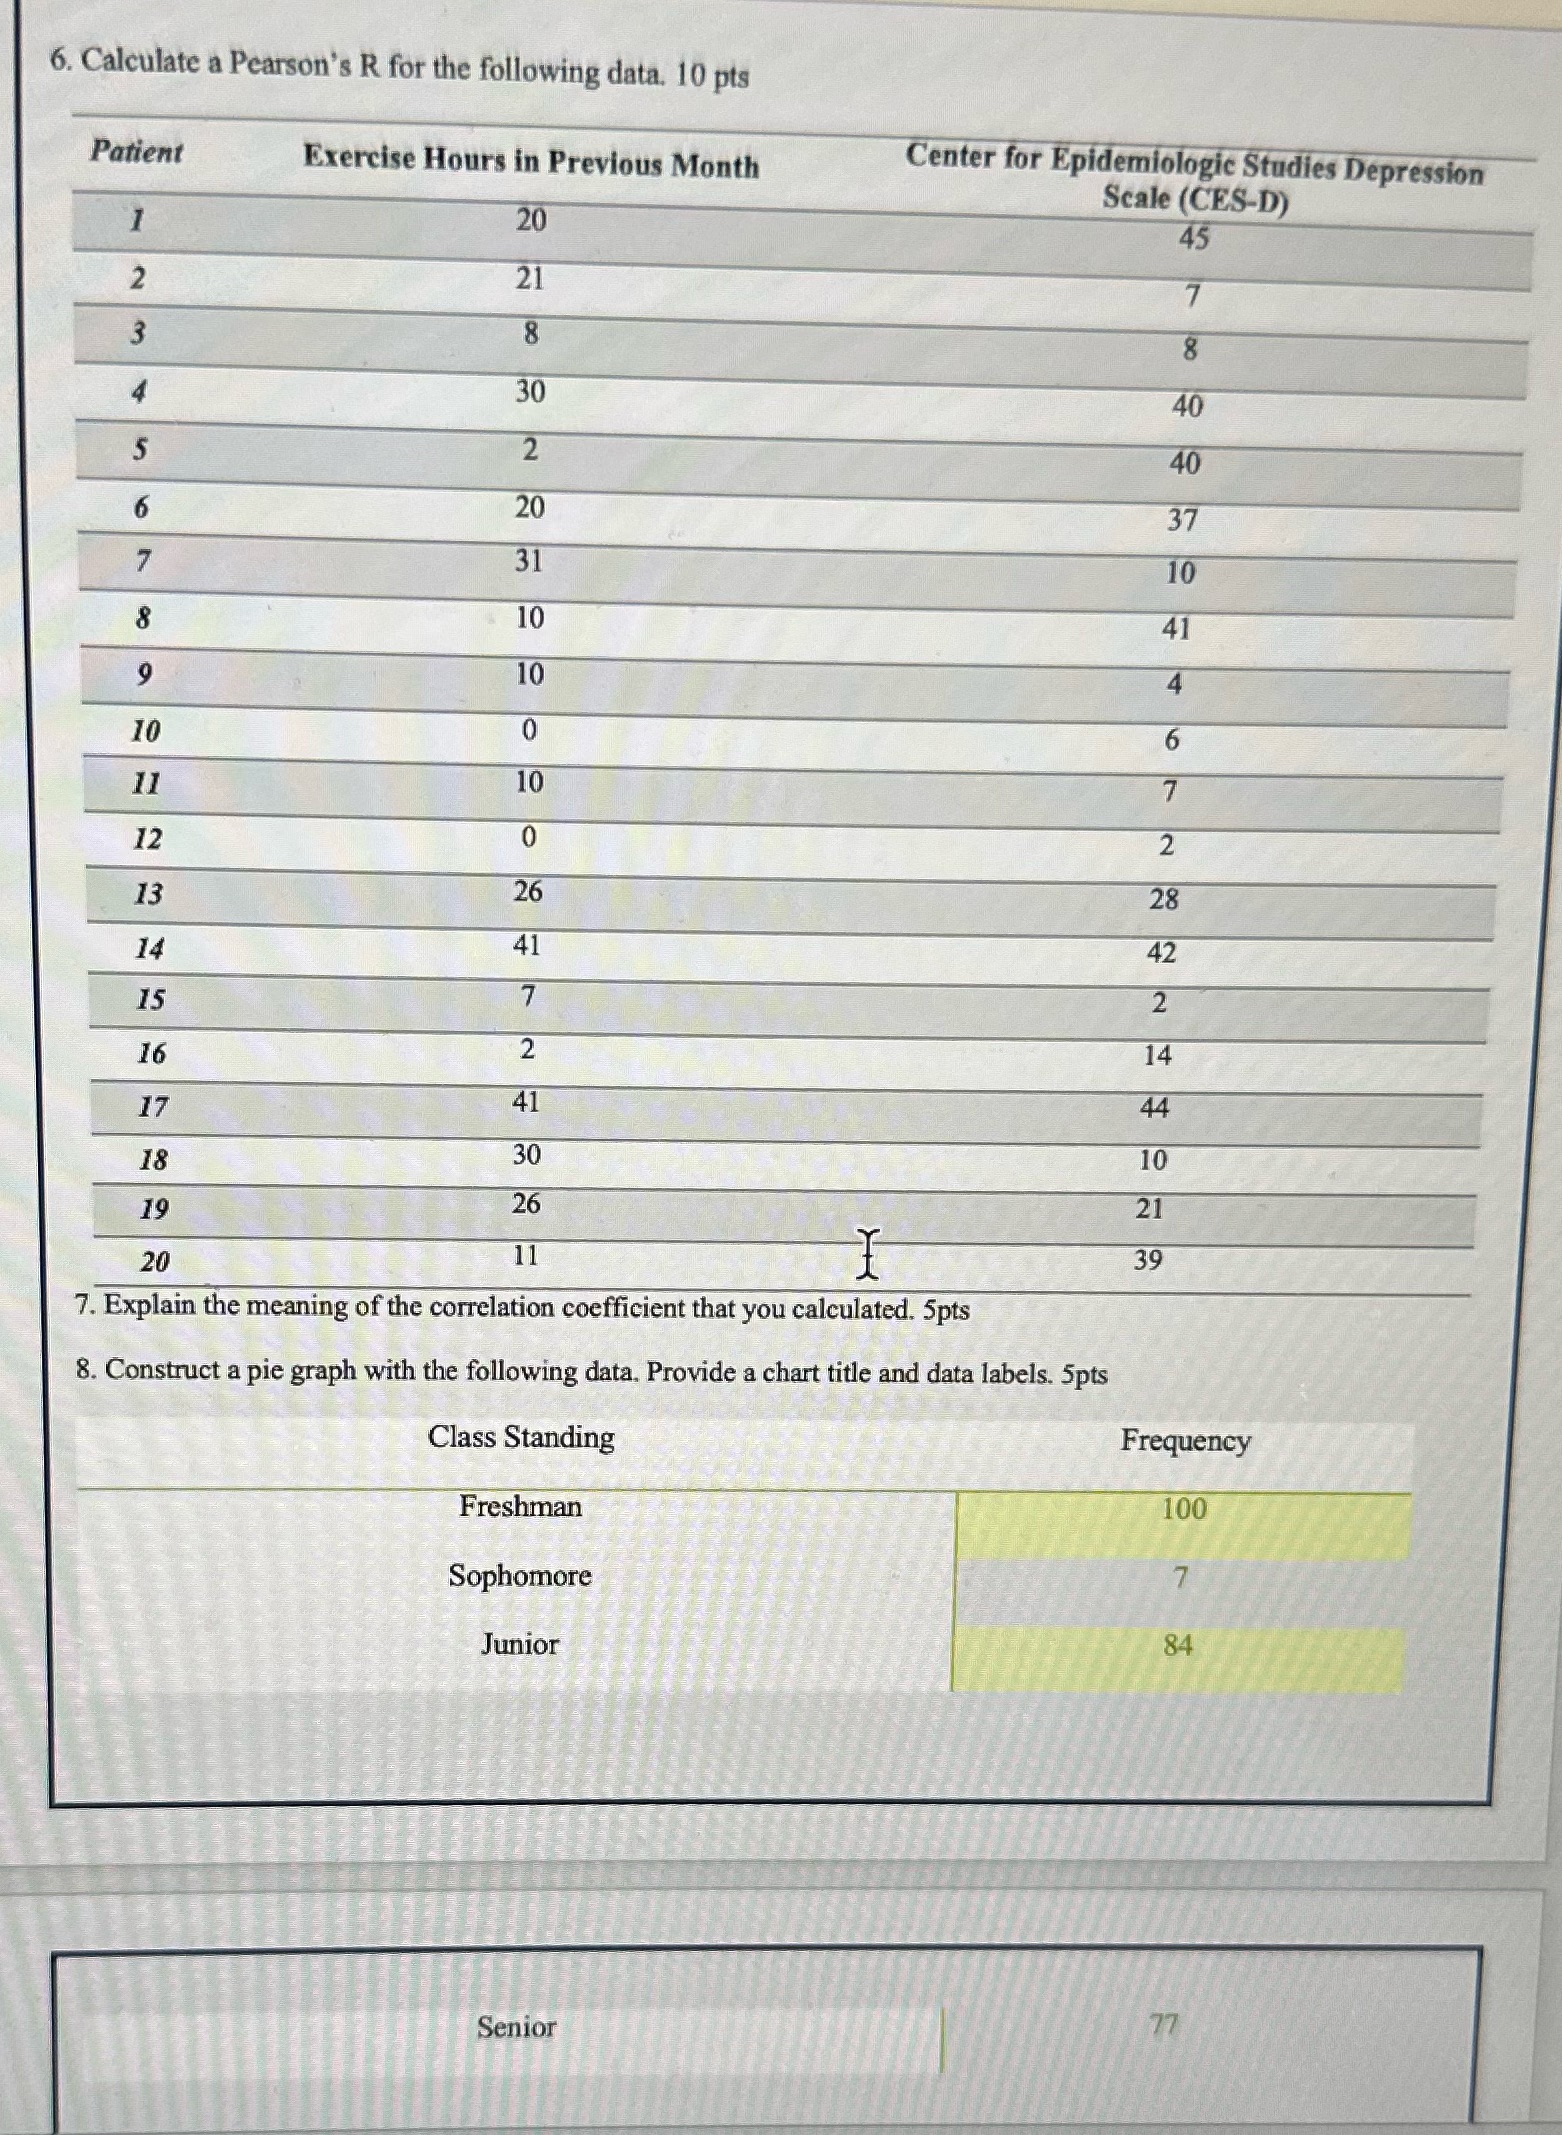
6. Calculate a Pearson's R for the following data. 10 pts Patient Exercise Hours in Previous Month Center for Epidemiologic Studies Depression Scale (CES-D) 20
Step by Step Solution
There are 3 Steps involved in it
Step: 1

Get Instant Access to Expert-Tailored Solutions
See step-by-step solutions with expert insights and AI powered tools for academic success
Step: 2

Step: 3
Ace Your Homework with AI
Get the answers you need in no time with our AI-driven, step-by-step assistance
Get Started
A First Course in Differential Equations with Modeling Applications
Authors: Dennis G. Zill
11th edition
1305965728, 978-1305965720