

Answered step by step
Verified Expert Solution
Question
1 Approved Answer
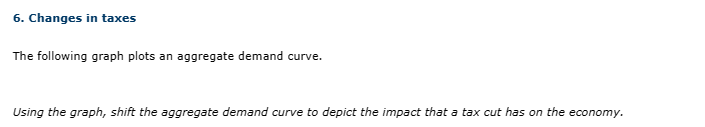
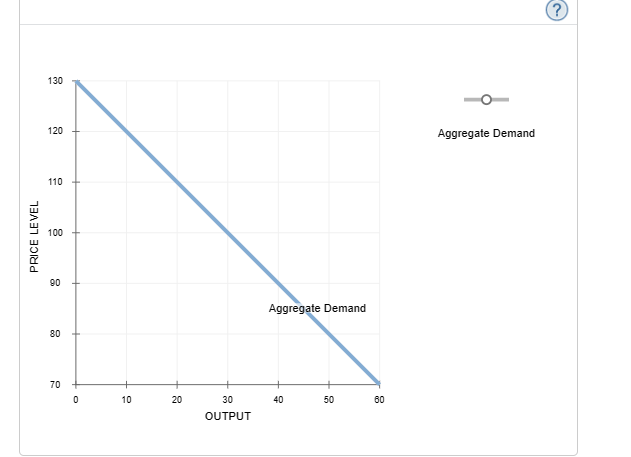
6. Changes in taxes The following graph plots an aggregate demand curve. Using the graph, shift the aggregate demand curve to depict the impact that

Step by Step Solution
There are 3 Steps involved in it
Step: 1

Get Instant Access to Expert-Tailored Solutions
See step-by-step solutions with expert insights and AI powered tools for academic success
Step: 2

Step: 3
Ace Your Homework with AI
Get the answers you need in no time with our AI-driven, step-by-step assistance
Get Started
Macroeconomics
Authors: N Gregory Mankiw
9th Edition
1464182892, 9781464182891