

Answered step by step
Verified Expert Solution
Question
1 Approved Answer
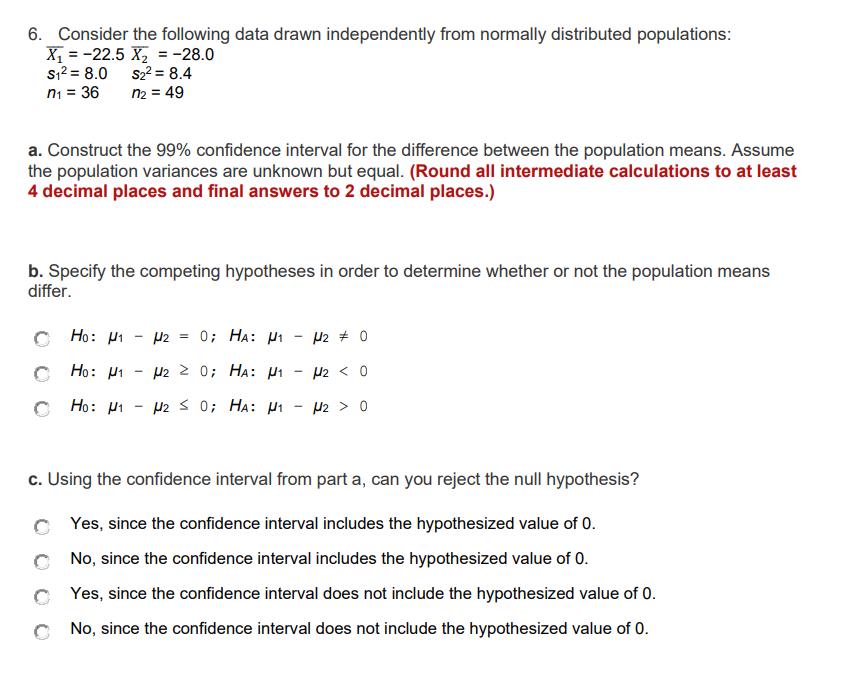
6. Consider the following data drawn independently from normally distributed populations: X1 = -22.5 X2 = -28.0 $12 = 8.0 $22 = 8.4 n1 =
Step by Step Solution
There are 3 Steps involved in it
Step: 1

Get Instant Access to Expert-Tailored Solutions
See step-by-step solutions with expert insights and AI powered tools for academic success
Step: 2

Step: 3
Ace Your Homework with AI
Get the answers you need in no time with our AI-driven, step-by-step assistance
Get Started
Simulation
Authors: Sheldon M Ross
6th Edition
0323899617, 9780323899611