

Answered step by step
Verified Expert Solution
Question
1 Approved Answer
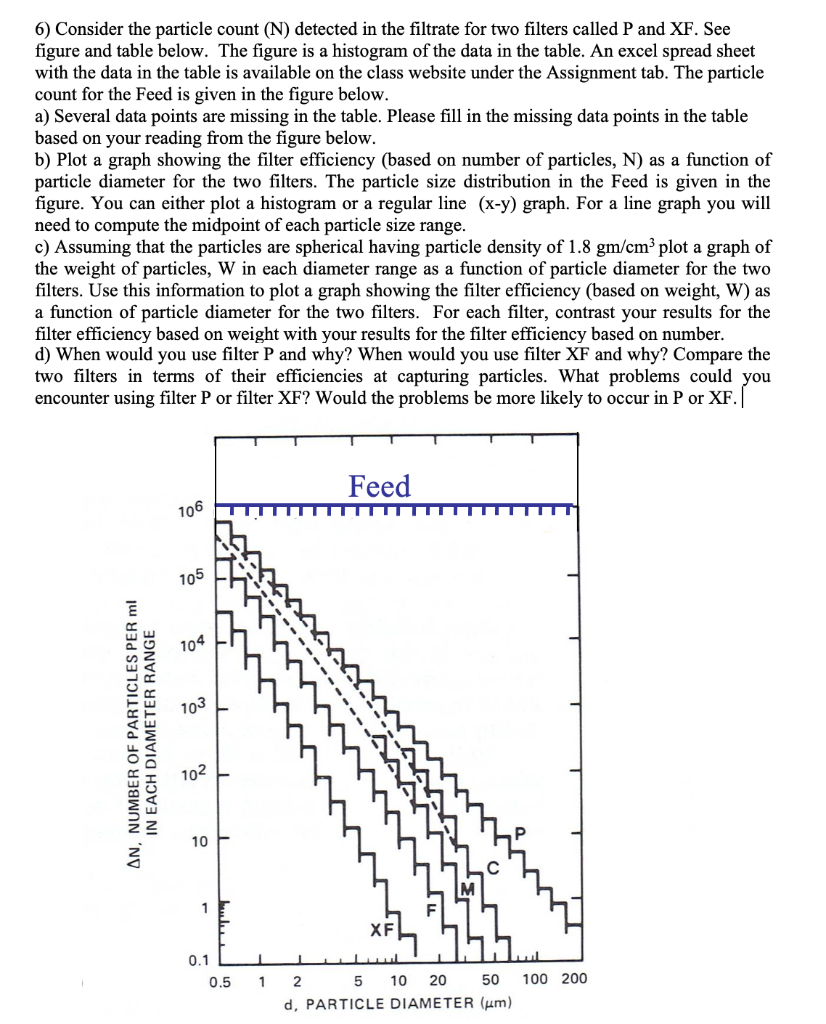
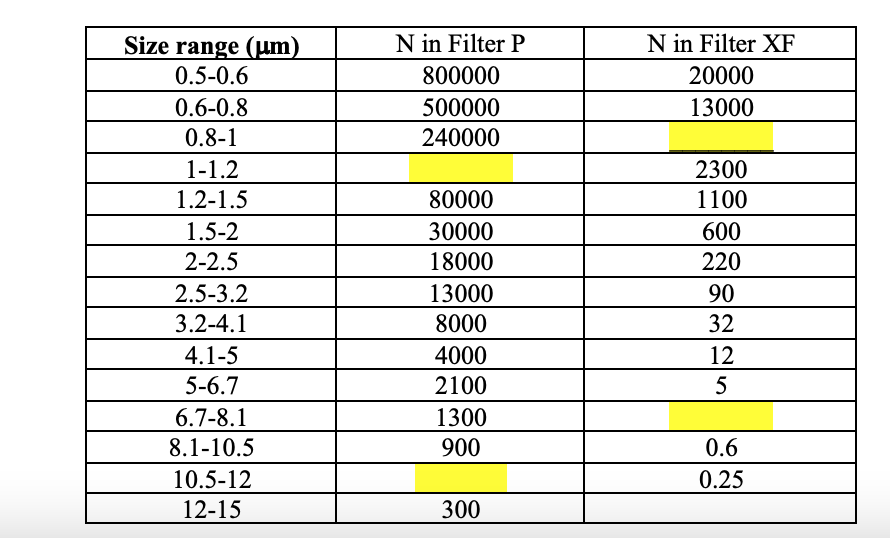
6) Consider the particle count (N) detected in the filtrate for two filters called P and XF. See figure and table below. The figure is
Step by Step Solution
There are 3 Steps involved in it
Step: 1

Get Instant Access to Expert-Tailored Solutions
See step-by-step solutions with expert insights and AI powered tools for academic success
Step: 2

Step: 3
Ace Your Homework with AI
Get the answers you need in no time with our AI-driven, step-by-step assistance
Get Started
Heat And Mass Transfer Fundamentals And Applications
Authors: Yunus Cengel, Afshin Ghajar
5th Edition
0073398187, 978-0073398181