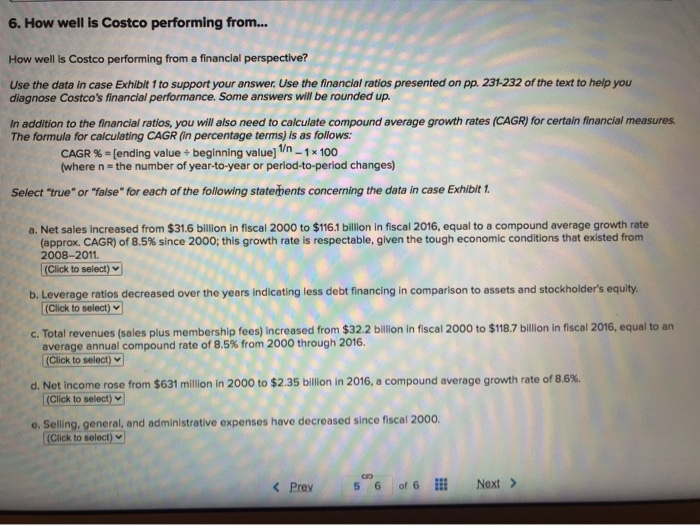
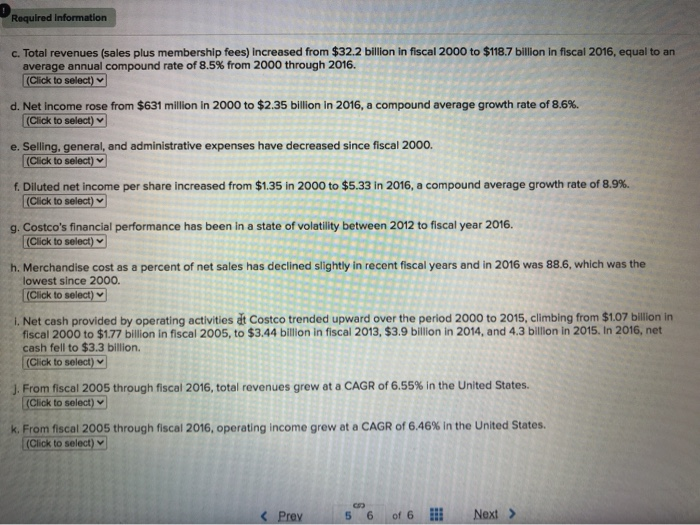
6. How well is Costco performing from... How well is Costco performing from a financial perspective? Use the data in case Exhibit 1 to support your answer. Use the financial ratios presented on pp. 231-232 of the text to help you diagnose Costco's financial performance. Some answers will be rounded up. In addition to the financial ratios, you will also need to calculate compound average growth rates (CAGR) for certain financial measures. The formula for calculating CAGR (in percentage terms) is as follows: CAGR % - (ending value + beginning value) 1 - 1* 100 (where n=the number of year-to-year or period-to-period changes) Select "true" or "false" for each of the following statements concerning the data in case Exhibit 1. a. Net sales increased from $31.6 billion in fiscal 2000 to $116.1 billion in fiscal 2016, equal to a compound average growth rate (approx. CAGR) of 8.5% since 2000; this growth rate is respectable, given the tough economic conditions that existed from 2008-2011 (Click to select) b. Leverage ratios decreased over the years indicating less debt financing in comparison to assets and stockholder's equity. (Click to select) c. Total revenues (sales plus membership fees) increased from $32.2 billion in fiscal 2000 to $118.7 billion in fiscal 2016, equal to an average annual compound rate of 8.5% from 2000 through 2016. (Click to select) d. Net income rose from $631 million in 2000 to $2.35 billion in 2016, a compound average growth rate of 8,6%. (Click to select) e. Selling, general, and administrative expenses have decreased since fiscal 2000. (Click to select) Required Information c. Total revenues (sales plus membership fees) Increased from $32.2 billion in fiscal 2000 to $118.7 billion in fiscal 2016, equal to an average annual compound rate of 8.5% from 2000 through 2016. (Click to select) d. Net income rose from $631 million in 2000 to $2.35 billion in 2016, a compound average growth rate of 8.6%. (Click to select) e. Selling, general, and administrative expenses have decreased since fiscal 2000. (Click to select) f. Diluted net income per share increased from $1.35 in 2000 to $5.33 in 2016, a compound average growth rate of 8.9% (Click to select) g. Costco's financial performance has been in a state of volatility between 2012 to fiscal year 2016. (Click to select) h. Merchandise cost as a percent of net sales has declined slightly in recent fiscal years and in 2016 was 88.6, which was the lowest since 2000. (Click to select) 1. Net cash provided by operating activities dt Costco trended upward over the period 2000 to 2015, climbing from $107 billion in fiscal 2000 to $1.77 billion in fiscal 2005, to $3.44 billion in fiscal 2013, $3.9 billion in 2014 and 4.3 billion in 2015. In 2016, net cash fell to $3.3 billion. (Click to select) J. From fiscal 2005 through fiscal 2016, total revenues grew at a CAGR of 6.55% in the United States. (Click to select) k. From fiscal 2005 through fiscal 2016, operating income grew at a CAGR of 6.46% in the United States. (Click to select) Prey of 6 Next > 6. How well is Costco performing from... How well is Costco performing from a financial perspective? Use the data in case Exhibit 1 to support your answer. Use the financial ratios presented on pp. 231-232 of the text to help you diagnose Costco's financial performance. Some answers will be rounded up. In addition to the financial ratios, you will also need to calculate compound average growth rates (CAGR) for certain financial measures. The formula for calculating CAGR (in percentage terms) is as follows: CAGR % - (ending value + beginning value) 1 - 1* 100 (where n=the number of year-to-year or period-to-period changes) Select "true" or "false" for each of the following statements concerning the data in case Exhibit 1. a. Net sales increased from $31.6 billion in fiscal 2000 to $116.1 billion in fiscal 2016, equal to a compound average growth rate (approx. CAGR) of 8.5% since 2000; this growth rate is respectable, given the tough economic conditions that existed from 2008-2011 (Click to select) b. Leverage ratios decreased over the years indicating less debt financing in comparison to assets and stockholder's equity. (Click to select) c. Total revenues (sales plus membership fees) increased from $32.2 billion in fiscal 2000 to $118.7 billion in fiscal 2016, equal to an average annual compound rate of 8.5% from 2000 through 2016. (Click to select) d. Net income rose from $631 million in 2000 to $2.35 billion in 2016, a compound average growth rate of 8,6%. (Click to select) e. Selling, general, and administrative expenses have decreased since fiscal 2000. (Click to select) Required Information c. Total revenues (sales plus membership fees) Increased from $32.2 billion in fiscal 2000 to $118.7 billion in fiscal 2016, equal to an average annual compound rate of 8.5% from 2000 through 2016. (Click to select) d. Net income rose from $631 million in 2000 to $2.35 billion in 2016, a compound average growth rate of 8.6%. (Click to select) e. Selling, general, and administrative expenses have decreased since fiscal 2000. (Click to select) f. Diluted net income per share increased from $1.35 in 2000 to $5.33 in 2016, a compound average growth rate of 8.9% (Click to select) g. Costco's financial performance has been in a state of volatility between 2012 to fiscal year 2016. (Click to select) h. Merchandise cost as a percent of net sales has declined slightly in recent fiscal years and in 2016 was 88.6, which was the lowest since 2000. (Click to select) 1. Net cash provided by operating activities dt Costco trended upward over the period 2000 to 2015, climbing from $107 billion in fiscal 2000 to $1.77 billion in fiscal 2005, to $3.44 billion in fiscal 2013, $3.9 billion in 2014 and 4.3 billion in 2015. In 2016, net cash fell to $3.3 billion. (Click to select) J. From fiscal 2005 through fiscal 2016, total revenues grew at a CAGR of 6.55% in the United States. (Click to select) k. From fiscal 2005 through fiscal 2016, operating income grew at a CAGR of 6.46% in the United States. (Click to select) Prey of 6 Next >


