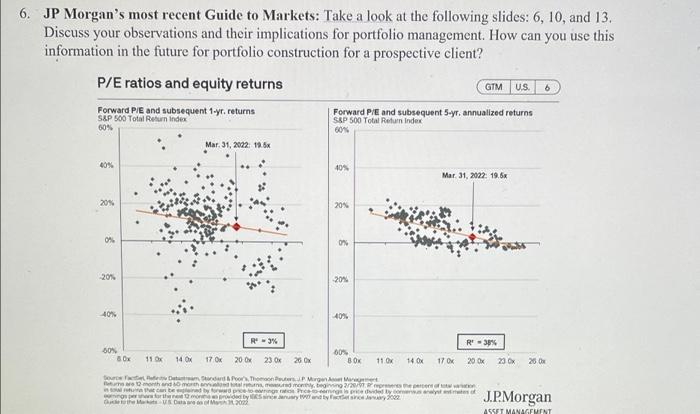
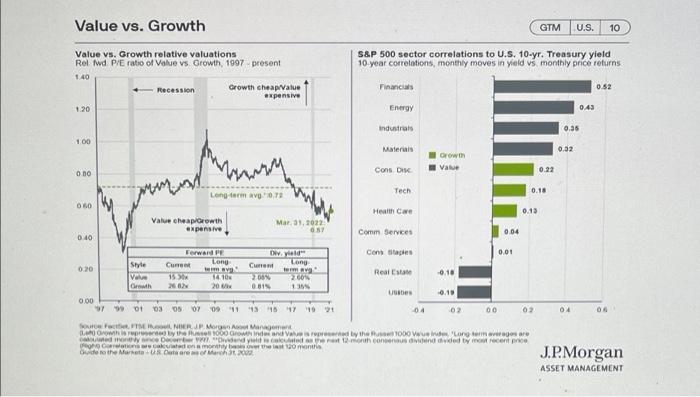
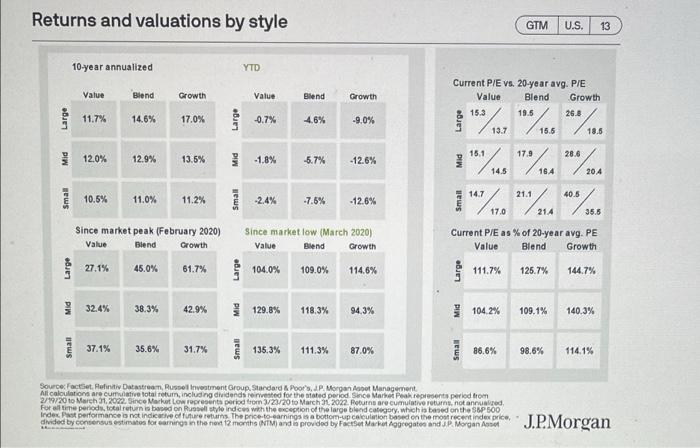
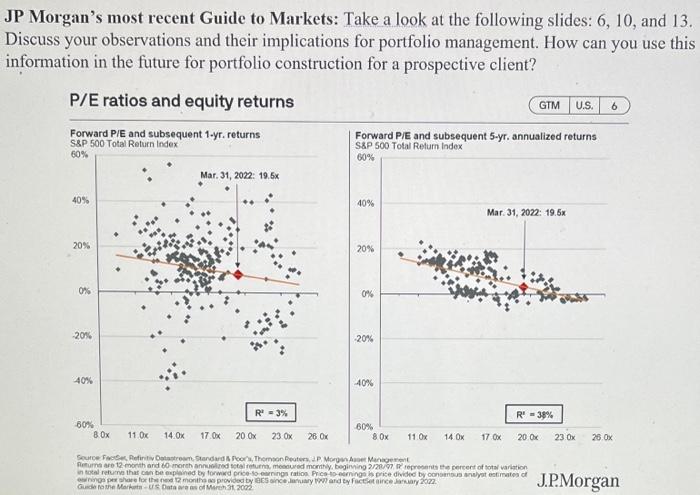
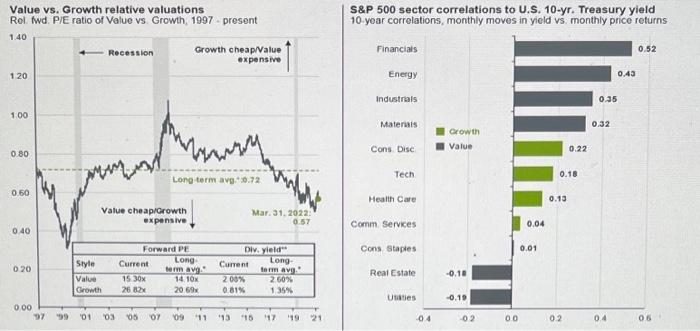
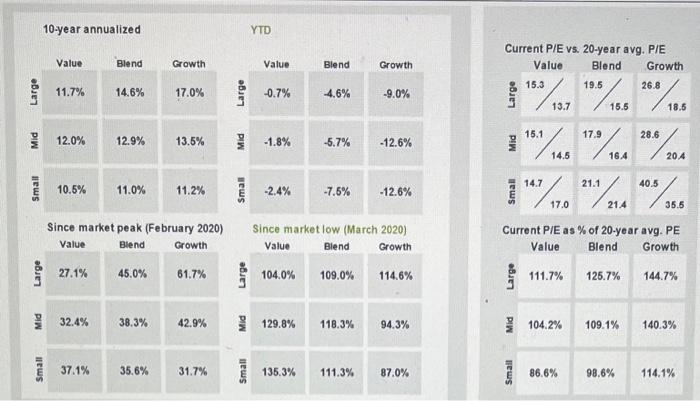
6. JP Morgan's most recent Guide to Markets: Take a look at the following slides: 6, 10, and 13. Discuss your observations and their implications for portfolio management. How can you use this information in the future for portfolio construction for a prospective client? P/E ratios and equity returns Forward PE and subsequent 1.yr. returns Forward P/E and subsequent 5-yr. annualized returns S&P 500 Total Return Index GIMUS 6 S&P 500 Total Return Index 60% 60% Mar 31, 2022: 19.8 40% Mar 31, 2022: 19.6% 20% 20% 0% 0% 20% 20% 40% 40% R3% R' -30% 80 8. Ox 11 x 14 OX 17 OK 20 Ox 00% 80K 23 x 26 x 11 OK 14 OK 17 OK 20 x 23 20 GO There month and more web.com forte Wandt 2002 2008 J.P. Morgan ASSET MANAGEMENT Value vs. Growth GTM U.S. 10 S&P 500 sector correlations to U.S. 10-yr. Treasury yield 10 year correlations, monthly moves in yield vs monthly price returns Value vs. Growth relative valuations Rel fwd P/E ratio of Value vs Growth, 1997 present 1.40 - Recession Growth cheap Value expensive 1.20 Finance 0.52 Energy 0.43 industrial 0.35 1 00 Materials 0.32 Orowth Value Cons DIN 0.00 0.22 Tech 0.18 Long term RVO.0.72 00 Health Care 0.13 Value cheap Growth expensive Mar 3.9022 037 Comm Services 0.04 0.40 Forward Dwyield Cons Staples 0.01 Style Cum Tong 0.20 Current Long va Real Estate -0.10 V 15 1410 2009 26 Orth 200 200 0819 11 Us 0.00 979 01 03 05 07 09 11 15 16 17 18 19 02 00 STMINER JP Morgan is 1000 Minded by the 1000 songs de condyland Phone din dided by a recent price For more on Bodo o the Market Utrecht 04 04 J.P. Morgan ASSET MANAGEMENT Returns and valuations by style GTM U.S. 13 10-year annualized YTD Value Blend Growth Value Blend Growth Current P/E vs. 20-year avg. P/E Value Blend Growth 26.8 Large 11.7% 14.6% 17.0% Large -0.7% 4.6% -9.0% Large "", "...... 13.7 15.6 18.8 17.9 28.6 12.0% 12.9% 13.5% 1.8% -5.7% -12.6% 15/164 204 21.1 40.5 Small 10.5% 11.0% 11.2% Small -2.4% -7.6% -12.6% "/,. *). **.56 17.0 21.4 35.5 Since market peak (February 2020) Value Blend Growth Since market low (March 2020) Value Blend Growth Current P/E as % of 20-year avg. PE Value Blend Growth Large 27.1% 45.0% 61.7% Large 104.0% 109.0% 114.6% Large 111.7% 125.7% 144.7% 32.4% 38.3% 42.9% 129.8% 118,3% 94.3% 104.2% 109.1% 140.3% Small 37.1% 35.6% 31.7% Small 135.3% 111.3% 87.0% Small 86.6% 98.6% 114.1% SourceFacet. Hoft Datastrom Russell Investment Group, Standard & Poor's, JP Morgan Management All calculations are comitive total retum, including dividends revested for the stated period Since Market Peak represent period from 2/19/20 to March 1.2022. Gince Market Low representa period from 1/23/20 to March 1, 2002. turno are cumulative returns, not annuaired For me periods, total return is based on Russell style indes with the exception of the large blend calipty, which is based on the P500 Index of performance is vindicative of future returns The price to earnings is a bottom-up calculation based on the most recent index price, divided by consensus estimates for earnings in the new 12 months NTM) and is provided by FactSet Market Aggregates and JP Morgan J.P. Morgan JP Morgan's most recent Guide to Markets: Take a look at the following slides: 6, 10, and 13. Discuss your observations and their implications for portfolio management. How can you use this information in the future for portfolio construction for a prospective client? P/E ratios and equity returns GTM U.S. 6 Forward P/E and subsequent 1-yr. returns S&P 500 Total Return Index 60% Forward P/E and subsequent 5-yr. annualized returns S&P 500 Total Return Index 60% Mar. 31, 2022: 19.5% 40% 40% Mar 31, 2022: 19.6x 20% 20% 0% 0% 20% 20% 40% 40% R = 3% R' = 38% 80% 8. Ox 11 OK 14.0x 17.0% 60% 8 0x 20 Ox 23 Ox 26 OK 11 Ox 14 Ox 17 Ox 20 OK 26 Ox Source For Rent Dataran Standard Thomson Reuters.P. Morge Manager Reumero 12 month and 60 month and totalet, med month, beginning 2/20/07 represents the percent of Station in total that be explained by forward to gration Pricing price divided by consystems of ang peshore for the month provided by since and tyFace inceary 2022 Guide to the Markus Dans of March 2003 J.P. Morgan S&P 500 sector correlations to U.S. 10-yr. Treasury yield 10 year correlations, monthly moves in yield vs monthly price returns Value vs. Growth relative valuations Rel. fwd. P/E ratio of Value vs. Growth, 1997 present 1.40 Recession Growth cheap/Value expensive 120 Financials 0.52 Energy 0.43 Industrials 0.35 100 Materuis 0.32 Growth Value 0.80 Cons Disc 0.22 /, M Tech 0.18 Long term avg. 20.72 0.50 Health Care 0.13 Value cheap/Growth expensive Mar. 31. 2022 0:57 Comm Services 0.04 0.40 Cons Staples 0.01 020 Style Value Growth Forward PE Long Current torm avg. 15 30% 14 10 26 2x 20.6% Div. yield" Current Long torm avg 2004 2 60% 0.81% 135% Real Estate -0.10 Uties 0.19 0.00 '01 03 05 07 09 11 13 15 17 1921 04 02 00 02 04 05 10-year annualized YTD Value Blend Growth Value Blend Growth Current P/E vs. 20-year avg. P/E Value Blend Growth 26.8 Large 11.7% 14.6% 17.0% Large -0.7% -4.6% -9.0% 13.7 15.5 18.5 17.9 28.6 12.0% 12.9% 13.5% -1.8% -5.7% -12.6% I ", "S...) "> :" 1991." ... *9.204 1"77. *** 786 ) 14.5 16.4 14.7 21.1 Small 10.5% 11.0% 11.2% Small -2.4% -7.5% -12.6% 17.0 21.4 35.5 Since market peak (February 2020) Value Blend Growth Since market low (March 2020) Value Blend Growth Current P/E as % of 20-year avg. PE Value Blend Growth Large 27.1% 45.0% 61.7% Large 104.0% 109.0% 114.6% Large 111.7% 125.7% 144.7% Mid 32.4% 38.3% 42.9% Mid 129.8% 118.3% 94.3% 104.2% 109.1% 140.3% Small 37.1% 35.6% 31.7% Small 135.3% 111.3% 87.0% Small 86.6% 98.6% 114.1% 6. JP Morgan's most recent Guide to Markets: Take a look at the following slides: 6, 10, and 13. Discuss your observations and their implications for portfolio management. How can you use this information in the future for portfolio construction for a prospective client? P/E ratios and equity returns Forward PE and subsequent 1.yr. returns Forward P/E and subsequent 5-yr. annualized returns S&P 500 Total Return Index GIMUS 6 S&P 500 Total Return Index 60% 60% Mar 31, 2022: 19.8 40% Mar 31, 2022: 19.6% 20% 20% 0% 0% 20% 20% 40% 40% R3% R' -30% 80 8. Ox 11 x 14 OX 17 OK 20 Ox 00% 80K 23 x 26 x 11 OK 14 OK 17 OK 20 x 23 20 GO There month and more web.com forte Wandt 2002 2008 J.P. Morgan ASSET MANAGEMENT Value vs. Growth GTM U.S. 10 S&P 500 sector correlations to U.S. 10-yr. Treasury yield 10 year correlations, monthly moves in yield vs monthly price returns Value vs. Growth relative valuations Rel fwd P/E ratio of Value vs Growth, 1997 present 1.40 - Recession Growth cheap Value expensive 1.20 Finance 0.52 Energy 0.43 industrial 0.35 1 00 Materials 0.32 Orowth Value Cons DIN 0.00 0.22 Tech 0.18 Long term RVO.0.72 00 Health Care 0.13 Value cheap Growth expensive Mar 3.9022 037 Comm Services 0.04 0.40 Forward Dwyield Cons Staples 0.01 Style Cum Tong 0.20 Current Long va Real Estate -0.10 V 15 1410 2009 26 Orth 200 200 0819 11 Us 0.00 979 01 03 05 07 09 11 15 16 17 18 19 02 00 STMINER JP Morgan is 1000 Minded by the 1000 songs de condyland Phone din dided by a recent price For more on Bodo o the Market Utrecht 04 04 J.P. Morgan ASSET MANAGEMENT Returns and valuations by style GTM U.S. 13 10-year annualized YTD Value Blend Growth Value Blend Growth Current P/E vs. 20-year avg. P/E Value Blend Growth 26.8 Large 11.7% 14.6% 17.0% Large -0.7% 4.6% -9.0% Large "", "...... 13.7 15.6 18.8 17.9 28.6 12.0% 12.9% 13.5% 1.8% -5.7% -12.6% 15/164 204 21.1 40.5 Small 10.5% 11.0% 11.2% Small -2.4% -7.6% -12.6% "/,. *). **.56 17.0 21.4 35.5 Since market peak (February 2020) Value Blend Growth Since market low (March 2020) Value Blend Growth Current P/E as % of 20-year avg. PE Value Blend Growth Large 27.1% 45.0% 61.7% Large 104.0% 109.0% 114.6% Large 111.7% 125.7% 144.7% 32.4% 38.3% 42.9% 129.8% 118,3% 94.3% 104.2% 109.1% 140.3% Small 37.1% 35.6% 31.7% Small 135.3% 111.3% 87.0% Small 86.6% 98.6% 114.1% SourceFacet. Hoft Datastrom Russell Investment Group, Standard & Poor's, JP Morgan Management All calculations are comitive total retum, including dividends revested for the stated period Since Market Peak represent period from 2/19/20 to March 1.2022. Gince Market Low representa period from 1/23/20 to March 1, 2002. turno are cumulative returns, not annuaired For me periods, total return is based on Russell style indes with the exception of the large blend calipty, which is based on the P500 Index of performance is vindicative of future returns The price to earnings is a bottom-up calculation based on the most recent index price, divided by consensus estimates for earnings in the new 12 months NTM) and is provided by FactSet Market Aggregates and JP Morgan J.P. Morgan JP Morgan's most recent Guide to Markets: Take a look at the following slides: 6, 10, and 13. Discuss your observations and their implications for portfolio management. How can you use this information in the future for portfolio construction for a prospective client? P/E ratios and equity returns GTM U.S. 6 Forward P/E and subsequent 1-yr. returns S&P 500 Total Return Index 60% Forward P/E and subsequent 5-yr. annualized returns S&P 500 Total Return Index 60% Mar. 31, 2022: 19.5% 40% 40% Mar 31, 2022: 19.6x 20% 20% 0% 0% 20% 20% 40% 40% R = 3% R' = 38% 80% 8. Ox 11 OK 14.0x 17.0% 60% 8 0x 20 Ox 23 Ox 26 OK 11 Ox 14 Ox 17 Ox 20 OK 26 Ox Source For Rent Dataran Standard Thomson Reuters.P. Morge Manager Reumero 12 month and 60 month and totalet, med month, beginning 2/20/07 represents the percent of Station in total that be explained by forward to gration Pricing price divided by consystems of ang peshore for the month provided by since and tyFace inceary 2022 Guide to the Markus Dans of March 2003 J.P. Morgan S&P 500 sector correlations to U.S. 10-yr. Treasury yield 10 year correlations, monthly moves in yield vs monthly price returns Value vs. Growth relative valuations Rel. fwd. P/E ratio of Value vs. Growth, 1997 present 1.40 Recession Growth cheap/Value expensive 120 Financials 0.52 Energy 0.43 Industrials 0.35 100 Materuis 0.32 Growth Value 0.80 Cons Disc 0.22 /, M Tech 0.18 Long term avg. 20.72 0.50 Health Care 0.13 Value cheap/Growth expensive Mar. 31. 2022 0:57 Comm Services 0.04 0.40 Cons Staples 0.01 020 Style Value Growth Forward PE Long Current torm avg. 15 30% 14 10 26 2x 20.6% Div. yield" Current Long torm avg 2004 2 60% 0.81% 135% Real Estate -0.10 Uties 0.19 0.00 '01 03 05 07 09 11 13 15 17 1921 04 02 00 02 04 05 10-year annualized YTD Value Blend Growth Value Blend Growth Current P/E vs. 20-year avg. P/E Value Blend Growth 26.8 Large 11.7% 14.6% 17.0% Large -0.7% -4.6% -9.0% 13.7 15.5 18.5 17.9 28.6 12.0% 12.9% 13.5% -1.8% -5.7% -12.6% I ", "S...) "> :" 1991." ... *9.204 1"77. *** 786 ) 14.5 16.4 14.7 21.1 Small 10.5% 11.0% 11.2% Small -2.4% -7.5% -12.6% 17.0 21.4 35.5 Since market peak (February 2020) Value Blend Growth Since market low (March 2020) Value Blend Growth Current P/E as % of 20-year avg. PE Value Blend Growth Large 27.1% 45.0% 61.7% Large 104.0% 109.0% 114.6% Large 111.7% 125.7% 144.7% Mid 32.4% 38.3% 42.9% Mid 129.8% 118.3% 94.3% 104.2% 109.1% 140.3% Small 37.1% 35.6% 31.7% Small 135.3% 111.3% 87.0% Small 86.6% 98.6% 114.1%